Category: Uncategorized

  • How Long Can a House Run on Solar Power Alone?

    How Long Can a House Run on Solar Power Alone?

    If you’ve ever watched your electricity bill climb during a summer heatwave, you’ve probably wondered whether solar panels could replace your utility entirely. The short answer is that a house can run on solar power alone-but how long depends on three things: how much sunlight your location gets, how much battery storage you have, and how much energy your household actually consumes each day.

    Key Takeaways

    • With the right solar panel system and battery storage, a modern U.S. home can run on solar energy indefinitely in theory. In practice, daily runtime depends on sunlight availability, battery size, and household consumption. A typical 2,000 sq. ft. home using about 30 kWh per day could run 24–48 hours from a 10–20 kWh battery bank once panels recharge it on a sunny day, but far less during extended cloudy weather without grid backup.

    • Rooftop solar panels by themselves do not keep the lights on during a blackout unless paired with a battery and appropriate solar installation hardware. Without storage, your panels shut down when the grid goes down for safety reasons.

    • The question of how long a house can run on solar power alone is mostly a math problem: daily solar production plus battery capacity minus daily consumption. If production consistently exceeds consumption and you have enough power stored for nighttime hours, you can keep going.

    • Reputable solar companies-not DIY setups-are typically needed to properly size systems, manage net metering, and design for true or partial energy independence. Getting multiple quotes ensures you see how different system designs affect your real-world runtime.

    • Most solar panels convert 17 to 23 percent of sunlight into energy, and they typically last about 25 to 30 years. Even after their warranty expires, solar panels can produce energy for years beyond that window.
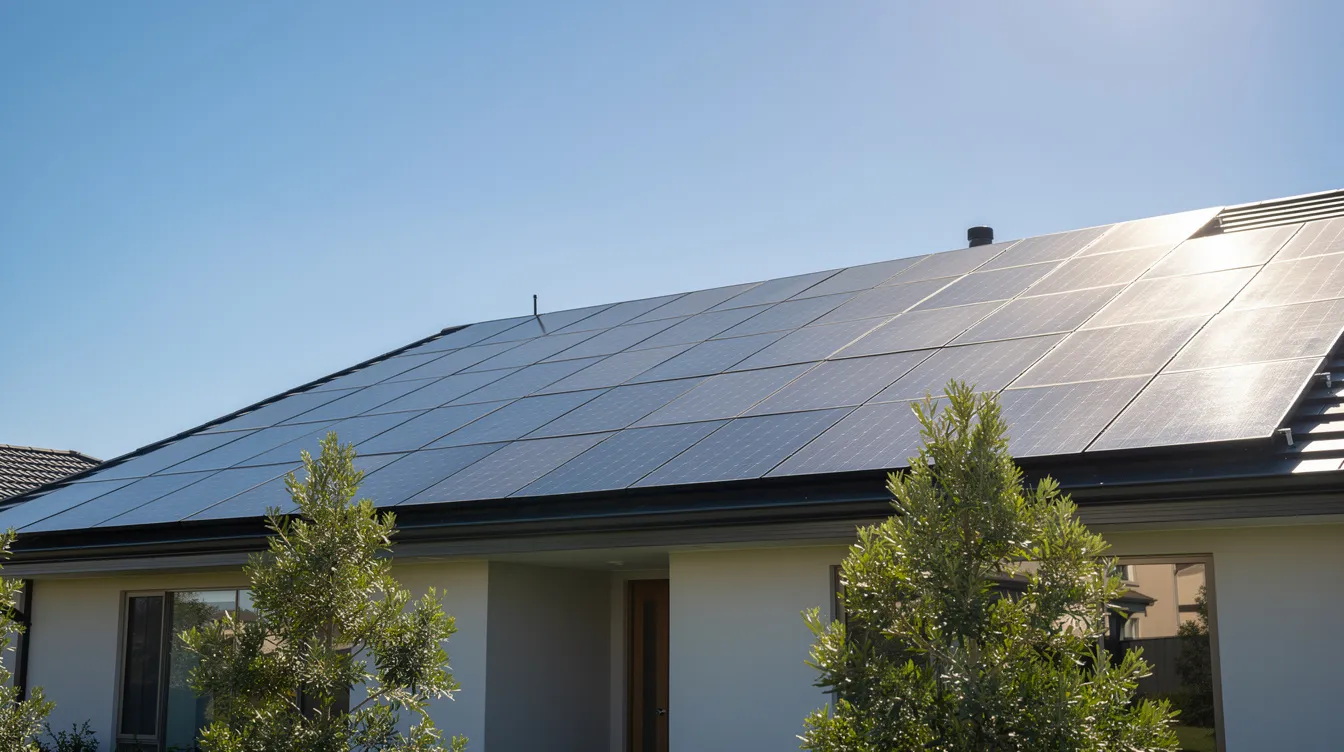
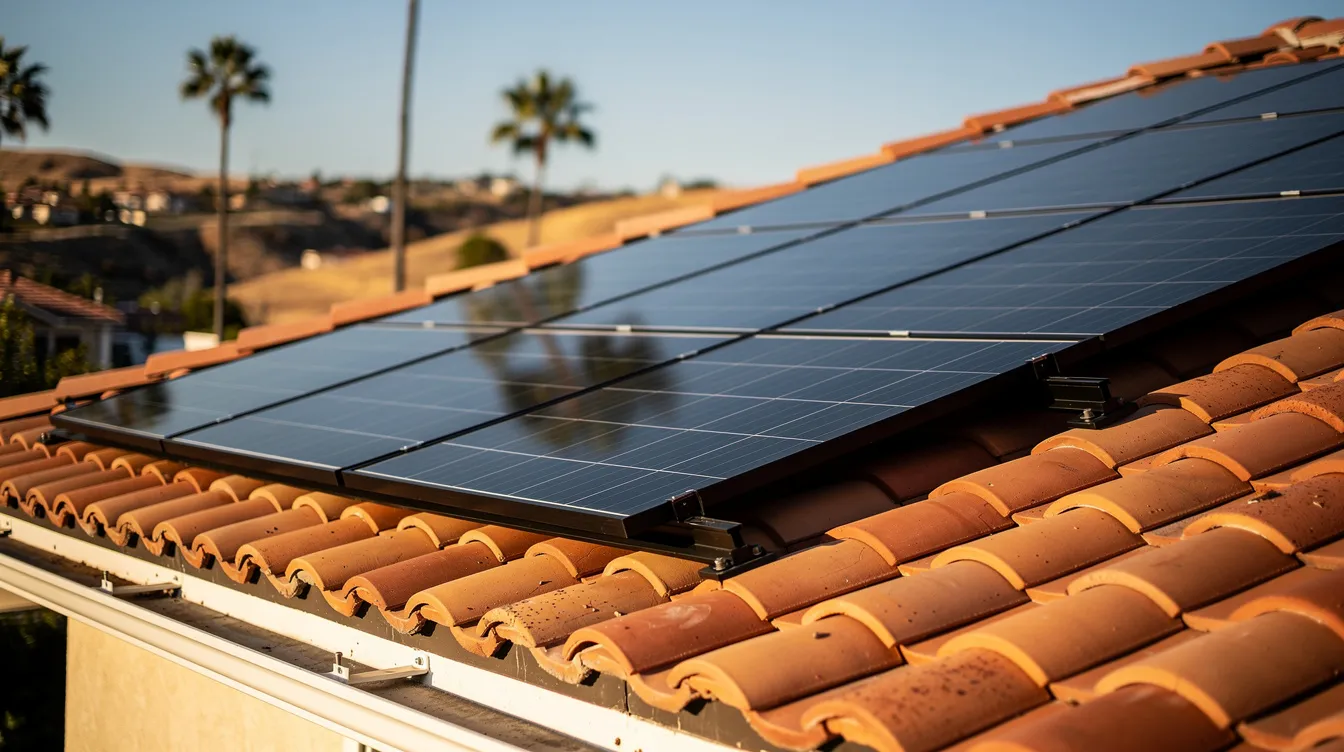
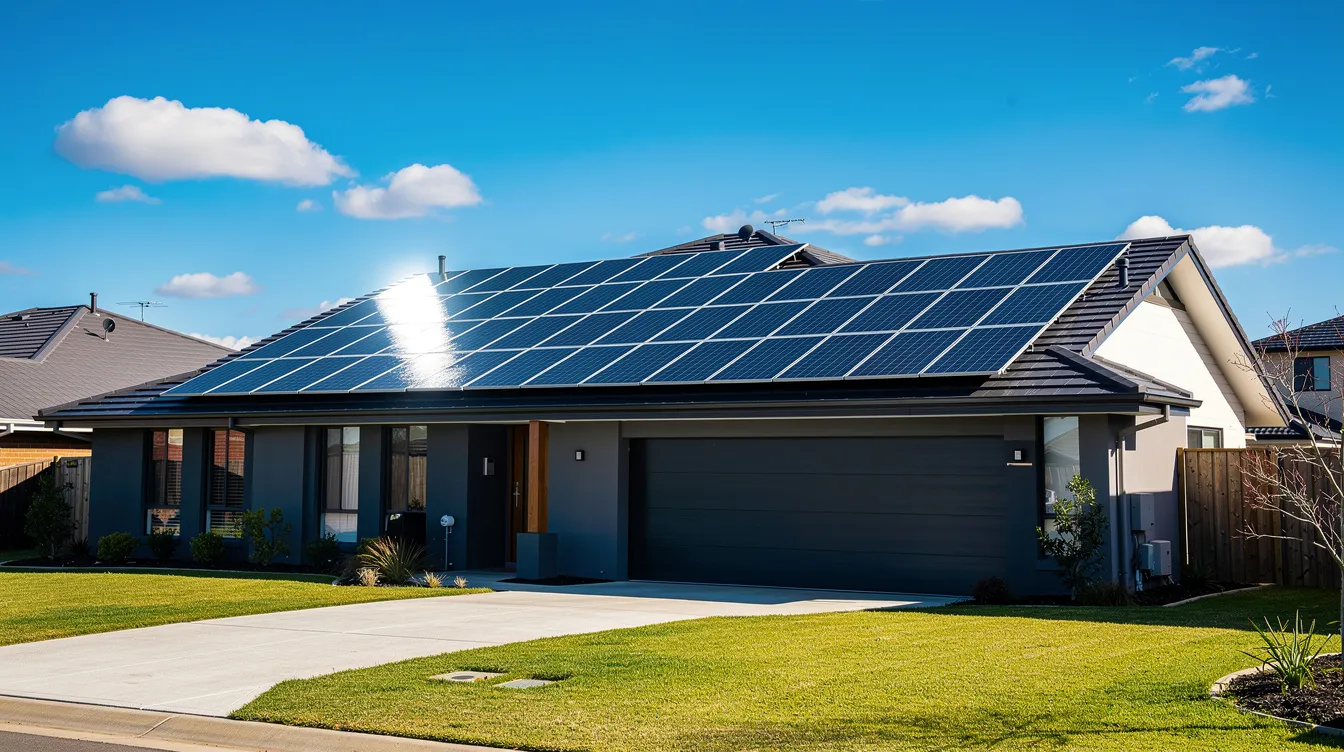
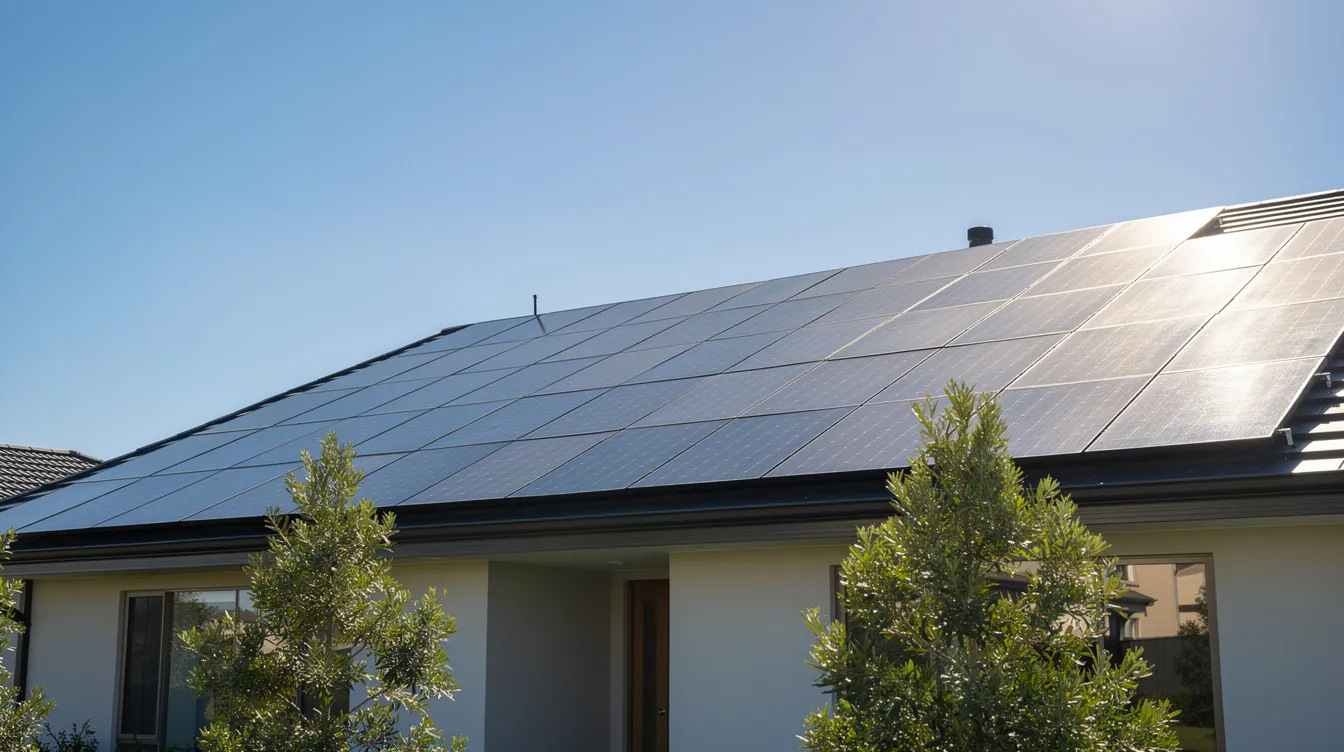
    The image depicts a residential rooftop fully covered with solar panels, glistening under a clear blue sky filled with bright sunshine. This solar panel system harnesses the sun's energy, contributing to clean energy solutions and potentially reducing energy bills for homeowners.

    1. What “Running on Solar Power Alone” Really Means

    Before diving into numbers, it helps to define what “running on solar alone” actually means. There are three distinct scenarios, and each one changes the answer dramatically.

    • Grid-tied solar with no batteries: Your solar panels produce electricity during the day, reducing what you pull from the grid. At night or during outages, the grid supplies your power. You cannot run on solar alone during a blackout.

    • Grid-tied solar with batteries: Your system stores excess solar energy in batteries for overnight use and short outages. You’re still connected to the grid but can operate independently for hours or days depending on battery size.

    • Off-grid solar: No utility connection, no power purchase agreement with a utility. The house relies 100 percent on solar panels, batteries, and sometimes a backup generator. To operate fully off-grid, a home must have a properly sized solar array, battery storage, and potential backup systems.

    In everyday language, people say they’re “running on solar alone” when their panels produce as much or more electricity than they use over a year, even if they’re still physically connected to the grid. In most U.S. states in 2026, the most common approach remains grid-tied solar with or without net metering-not fully off-grid solar energy systems.

    2. The Basic Math: How Much Energy Your House Uses

    Any answer to “how long can a house run on solar power alone?” starts with understanding how much energy your home actually uses per day, week, and season. Skip this step and you’re guessing.

    The average U.S. residential customer uses about 10,500–11,000 kWh per year according to Energy Information Administration reports, which works out to roughly 29–30 kWh per day. But that average hides enormous variation:

    Home Type

    Daily Usage

    Annual Usage

    Small apartment, mild climate

    10–15 kWh/day

    3,650–5,475 kWh/year

    Typical 3-bedroom house

    25–35 kWh/day

    9,125–12,775 kWh/year

    Large home with pool + EV charging

    50–70+ kWh/day

    18,250–25,550+ kWh/year

    To find your own number, look at a recent electric bill for “kWh used” over 30 days and divide by 30. Do this for several months to capture seasonal swings. Homes with electric heating or cooling will see sharp spikes in winter or summer.

    The takeaway: lower usage through energy-efficient appliances and smart habits lets a house run longer on solar and smaller battery banks. Energy-efficient homes require a smaller, more affordable solar array for full coverage. You don’t always need a bigger system-sometimes you need a leaner lifestyle.

    3. How Much Energy Solar Panels Can Produce Each Day

    A home’s daily solar energy production depends on system size (kW), local sun exposure measured in peak sun hours, panel orientation, and shading. Solar output depends heavily on peak sun hours, which vary by geographic location. The property must receive adequate peak sun hours per day to support solar generation.

    Here’s a concrete example: in Los Angeles, a 7 kW rooftop solar array from a reputable solar company can produce roughly 30–35 kWh on a sunny summer day-enough to cover an average home’s daily energy needs. But in December, that same system’s output drops to about 14–15 kWh per day because of shorter days and lower sun angles.

    A useful concept is the “production ratio”-the annual kWh produced per kW installed. Typical values range from 1.3 in cloudier regions to 1.6 or higher in the sunny Southwest. A 10 kW solar system produces about 15,000 kWh annually in a favorable location.

    Key variables that affect how much energy your panels produce:

    • System size: More panels mean more electricity, measured in kilowatts (kW)

    • Peak sun hours: Ranges from 3–4 hours/day in the Pacific Northwest to 6–7 in Arizona

    • Panel efficiency: Most solar panels convert 17 to 23 percent of sunlight into energy, though LONGi achieved a 33 percent solar cell efficiency record in 2025

    • Orientation: Solar panels perform best on south-facing roofs with a 15 to 40-degree slope in the Northern Hemisphere

    • Degradation: A solar panel’s output decreases over time due to degradation. Jinko Solar panels have a first-year degradation rate of 1 percent, and after 30 years, Jinko panels should produce at least 87.4 percent of their initial output. Q Cells guarantees 86 percent production capacity after 25 years

    The lifespan of a solar panel is about 30 years, and solar panels can produce energy well after their warranty expires. These are long-term assets that keep generating more electricity for decades.

    4. Role of Battery Storage: How Long Can You Run When the Sun Is Down?

    Solar batteries are what allow a home to truly run on solar alone overnight and during cloudy stretches. Without them, your panels are just a daytime discount on your energy bill. Battery storage systems are required to power a house 24/7, including at night or on overcast days. Sufficient storage capacity is necessary to run a home entirely on solar energy through night and cloudy periods.

    Battery energy capacity determines how long a battery can run a house, while power output dictates how many appliances can be run simultaneously. These are two different specs that both matter.

    A single 13.5 kWh class lithium-ion home battery can usually deliver about 9–11 kWh of usable energy once depth-of-discharge and inverter losses are factored in. The formula is straightforward:

    Usable Capacity = Rated Capacity × Depth of Discharge × Round-Trip Efficiency

    For example, a 15 kWh battery with 90 percent depth of discharge and 90 percent round-trip efficiency yields about 12.2 kWh of usable energy.
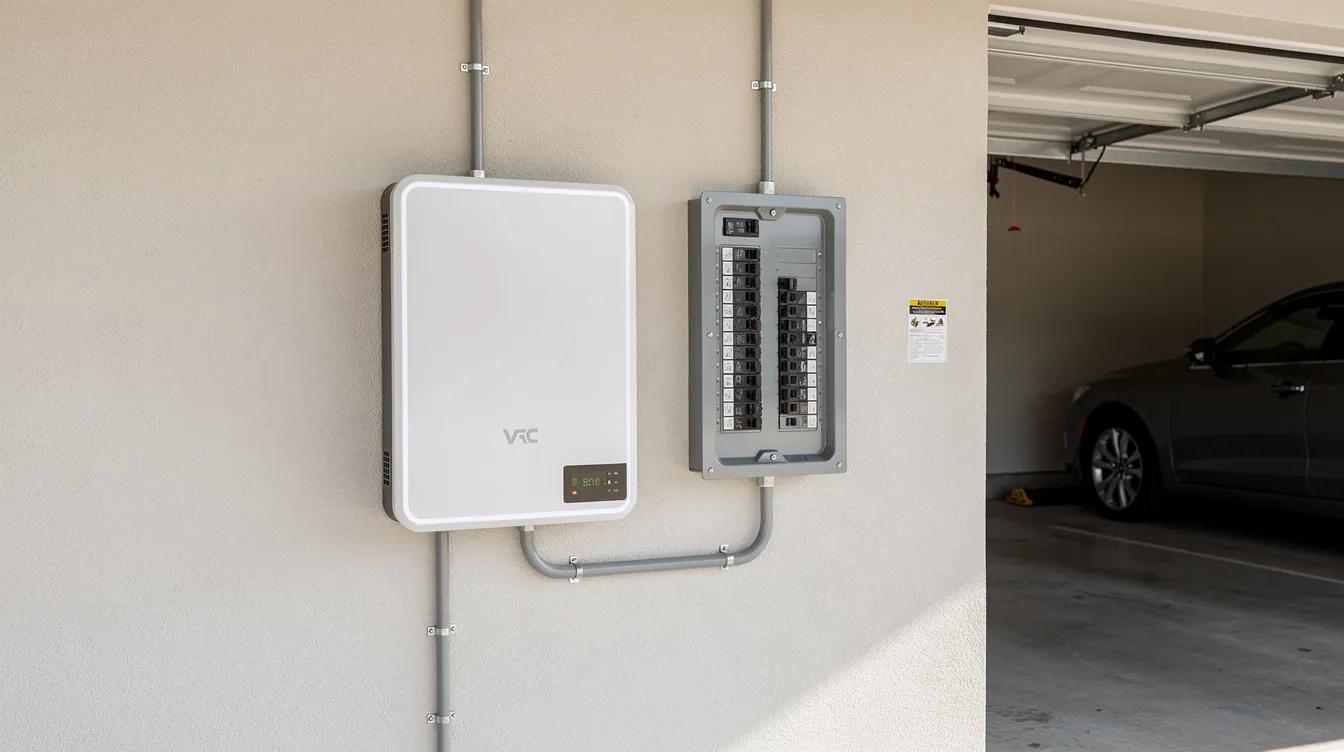
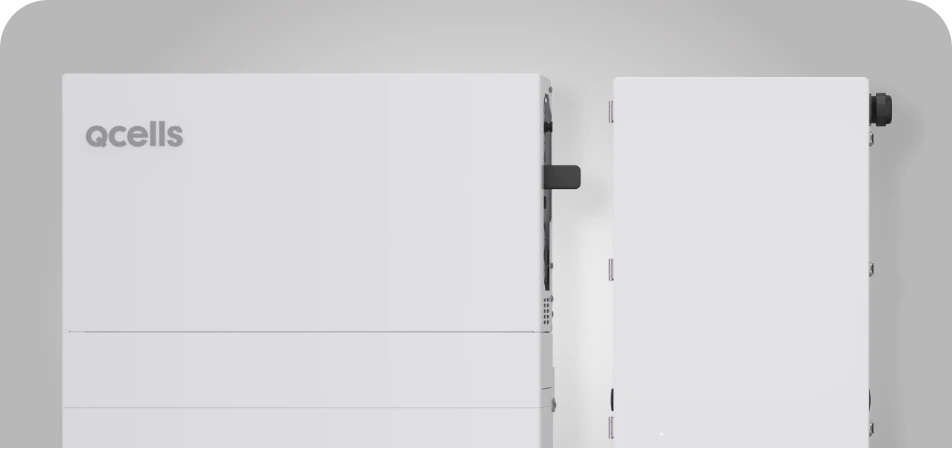
    The image shows a home battery storage unit mounted on the wall of a residential garage, positioned next to an electrical panel. This setup is designed to store solar energy generated by solar panels installed on the roof, providing a reliable source of power for the home.

    Here’s what that means in practice for a home using 30 kWh per day:

    Battery Setup

    Usable kWh

    Approximate Runtime

    Single 13.5 kWh battery

    ~11 kWh

    8–12 hours (critical loads only)

    Two batteries (27 kWh total)

    ~22 kWh

    16–24 hours (critical loads)

    Three batteries (40+ kWh total)

    ~33 kWh

    24–36 hours (critical loads)

    Running refrigerators, Wi-Fi, lights, and a few outlets on a moderate battery bank can stretch 1–3 days. But whole-house backup with air conditioning shortens runtime sharply. Batteries must provide buffer capacity for periods of limited sunlight, typically covering 1.5 to 3 days of usage in off-grid designs.

    Increasing battery capacity through multiple units in parallel stretches runtime but significantly raises solar installation cost. This is where experienced solar companies help balance budget and resilience with the right battery options.

    5. Scenarios: How Long a House Can Run on Solar in Real Life

    The question is best answered through realistic scenarios rather than a single universal number. Here’s what each setup looks like in practice.

    Scenario 1: Grid-tied solar, no battery. The house is effectively running on solar energy during sunny hours. Your energy bill drops, you may earn bill credits through net metering, and you save money month over month. But during grid outages, you lose power despite having panels on the roof. Runtime on solar alone during an outage: zero.

    Scenario 2: Grid-tied solar with a 10–20 kWh battery. A reasonably efficient home can ride through typical overnight hours and short blackouts, giving 12–36 hours of autonomy depending on usage. This is the sweet spot for most homeowners who want energy savings plus basic backup.

    Scenario 3: Off-grid cabin. A smaller, ultra-efficient dwelling with propane or wood heat and a modest 4 kW solar array plus battery bank can operate for several cloudy days if loads are carefully managed. These setups are designed around the worst month of sun, not the best.

    Scenario 4: Large home with heavy loads. Even 15–20 kW of solar and 40+ kWh of batteries might only cover 8–24 hours if central A/C, electric heating, and EV charging run unchecked. Enough power for comfort requires either massive storage or serious load management.

    6. Weather, Seasons, and Location: How They Change the Answer

    Geography and climate have a huge impact on how long a home can run on solar power alone, especially for off-grid systems or those with limited battery storage. Weather and sunlight availability can significantly affect solar production and battery charging.

    Sunny Southwest states like Arizona, Nevada, and Southern California enjoy 5–7 peak sun hours daily even in winter, making them ideal for solar. Homes here can rely heavily on solar year-round.

    Cloudier regions like the Pacific Northwest and Northeast see winter production drop enough that even well-sized systems may need grid backup or auxiliary generators to avoid running out of power. A 7 kW system in Seattle might produce half of what it generates in Phoenix during December.
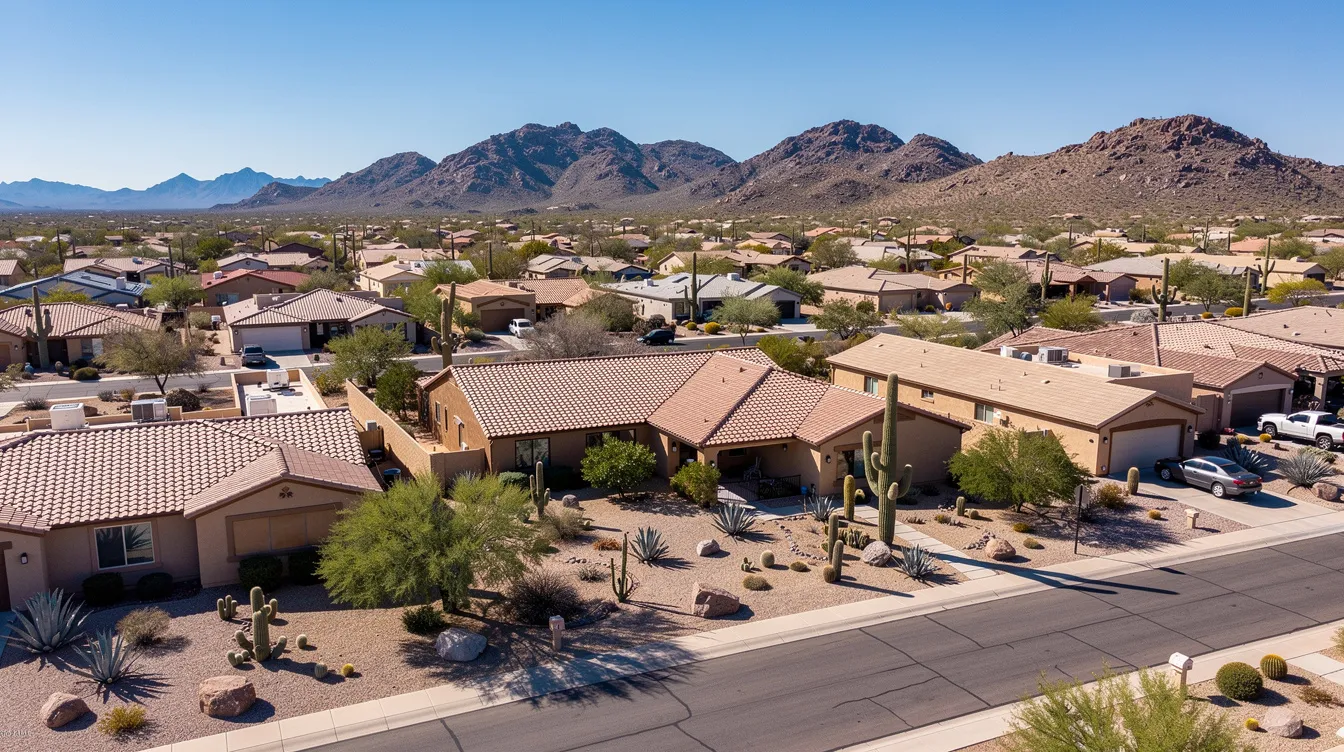
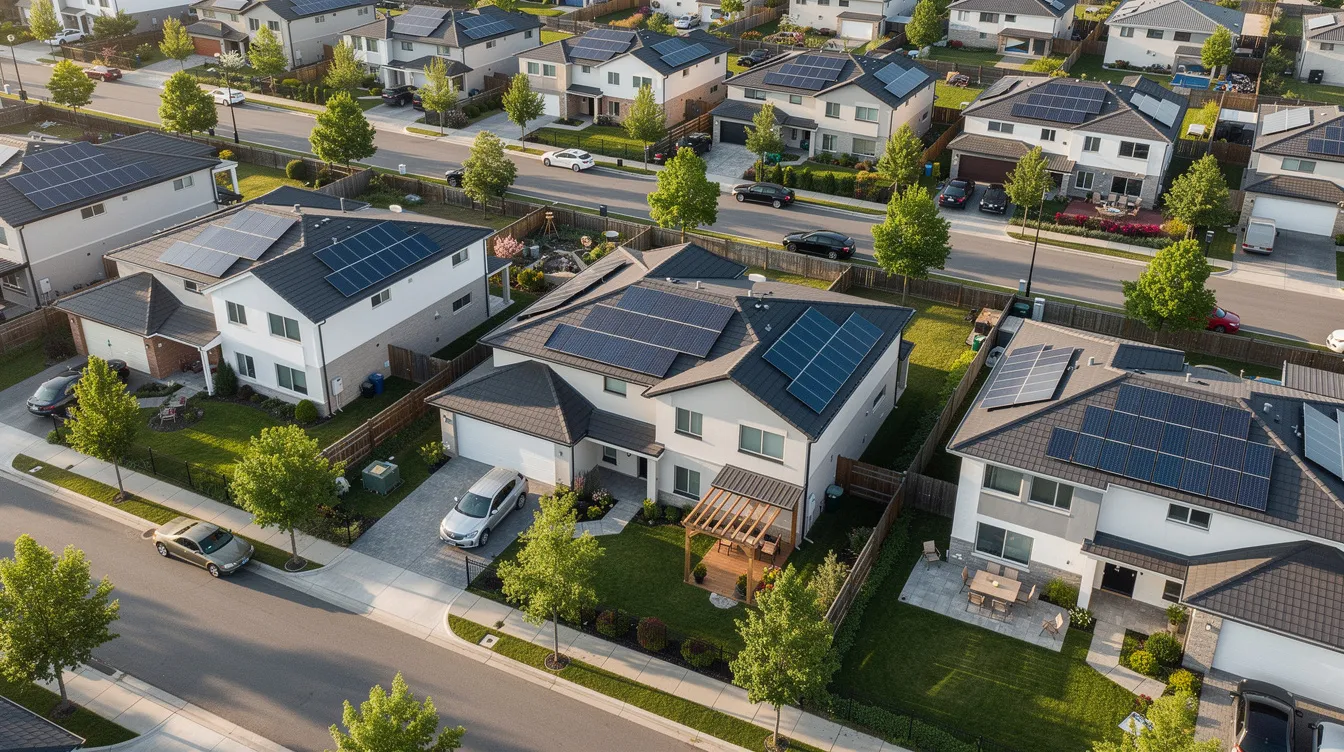
    An aerial view showcases a sunny desert neighborhood in the American Southwest, featuring houses equipped with solar panels on their rooftops under clear blue skies. This image highlights the potential for solar energy, illustrating how residential solar installations can harness the sun's energy for clean power and energy savings.

    Multi-day storms are the real stress test. During a 3–5 day cloudy stretch, a house with only one day of storage will need either the grid, a generator, or significant cutbacks in energy consumption to stay powered. How much sunlight your region reliably receives-even in its worst month-defines your system’s floor, not its ceiling.

    High-quality solar companies and any top solar company installer will use long-term solar radiation data, not just a single year’s numbers, when sizing arrays for reliable performance in direct sunlight and overcast conditions alike.

    7. Net Metering and Grid-Tied Systems: “Solar Alone” Over a Year

    Many grid-tied homes with net metering don’t go off-grid but do offset nearly all their electricity use over the course of a year. Grid-tied systems allow excess power to be sent back to the grid for credits during the day.

    Net metering works like this: when your solar panels produce more electricity than your house needs during the day, the excess flows to the grid. Your utility credits you for that energy. At night or in winter when you need more electricity than you produce, you draw from the grid and those bill credits offset the cost. Net metering can provide utility bill credits for solar users, effectively turning the grid into virtual storage.

    With favorable net metering policies, a household can effectively run on solar power alone on an annual basis even though it still relies on the grid overnight. The whole story is that you produce plenty of energy over the year-you just don’t produce it at the same time you use it.

    Regional changes matter. California’s NEM 3.0 reduced export credits, making batteries and smarter load management more important for getting value from going solar. An experienced local solar company will model yearly solar production versus usage through energy monitoring tools to help homeowners see how much of their power can practically come from the sun’s energy.

    8. System Size: How Big Does Solar Need to Be to Power a House?

    Proper system sizing is crucial to determining how long a house can run on solar alone without constantly depleting batteries. The solar panel array must be large enough to produce all the kilowatt-hours the household consumes annually.

    Here’s the basic calculation: for a home using 30 kWh per day in a region with 5 peak sun hours, about 6–7 kW of solar panels installed is needed just to cover an average day’s consumption. Homes seeking real autonomy often oversize their arrays by 10–40 percent above average loads to handle cloudy days and seasonal dips in production. The average system size for residential solar varies by region but typically falls between 6 and 12 kW.

    Today, 97 percent of home solar panels produce between 400 and 460 watts per panel. That means a 7 kW system requires roughly 15–18 panels depending on wattage. The roof must have enough surface area to hold the solar panels and be structurally sound.

    Limited roof space can constrain system size, making high-efficiency panels from the best solar companies more attractive even if the cost per watt is slightly higher. A detailed site assessment during the installation process-evaluating tilt, orientation, and shading-determines how much energy a given kW of solar actually produces. Better performance comes from getting these details right upfront.

    9. Daily Load Management: Stretching How Long Solar Power Lasts

    Even with a fixed solar and battery setup, smart usage habits can dramatically extend how long the house runs on solar power alone during outages or low-sun periods. Energy-efficient appliances significantly reduce overall consumption, making full solar power easier to achieve.

    High-draw appliances to manage carefully:

    • Central HVAC systems (3,000–5,000 watts)

    • Electric ovens and dryers (2,000–5,000 watts)

    • Pool pumps (1,500–2,500 watts)

    • EV chargers (1,400–7,700 watts depending on level)

    Limiting these during blackouts can double or triple battery runtime. Shifting flexible loads like laundry, EV charging, or pool equipment to midday hours when solar panels are producing strongly and batteries are full is one of the simplest ways to stretch your system.
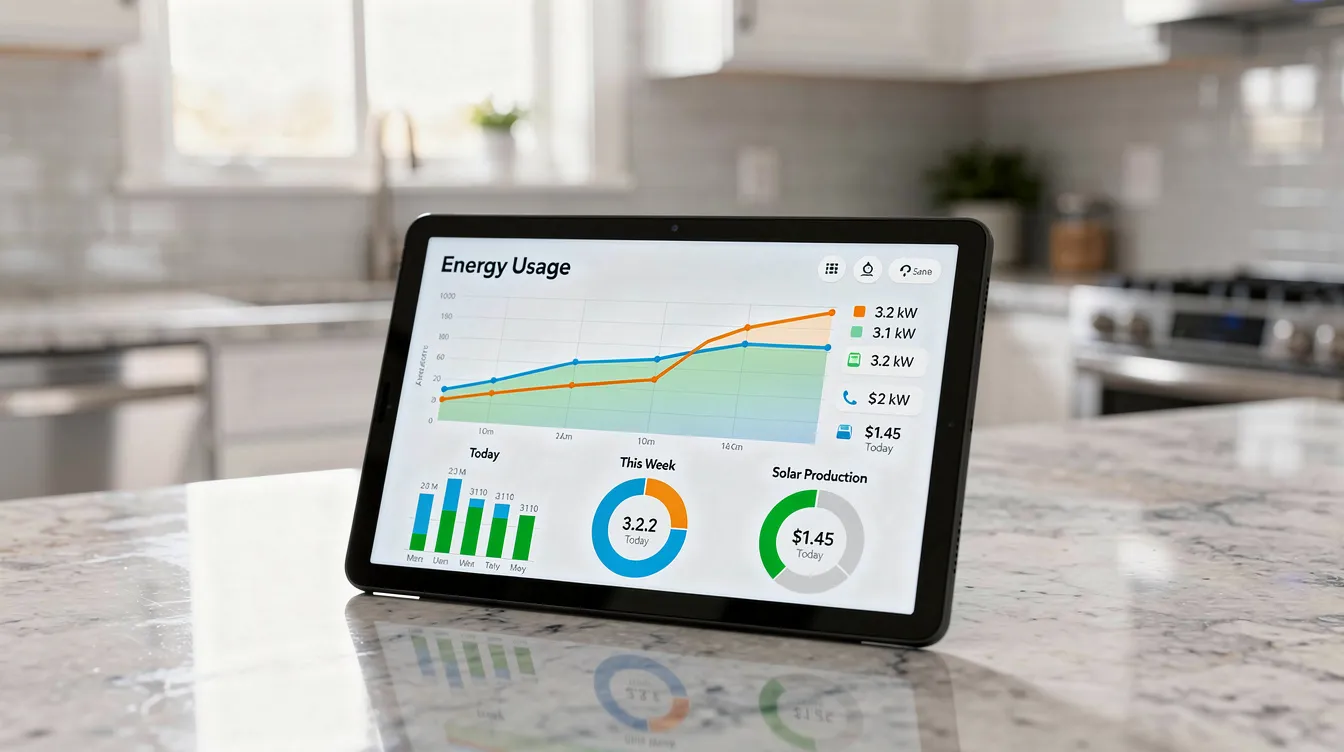
    The image shows a modern tablet display on a kitchen counter, featuring energy monitoring graphs that depict energy usage. This smart home technology highlights the benefits of solar power, showcasing how solar panel installations can help manage energy needs and potentially reduce utility bills.

    Some modern inverters and smart panels from leading solar companies allow automated load shedding or prioritization during backup operation. These systems can keep your refrigerator and lights running while temporarily pausing less critical circuits.

    A “minimal survival load” (fridge, lights, Wi-Fi, phone charging) might draw just 3–5 kWh per day. A “normal lifestyle load” with A/C and cooking runs 25–35 kWh. That difference is the gap between one day and one week of battery runtime.

    10. Backup Strategies: When Solar Alone Isn’t Enough

    In many climates, there will be rare events-extended snow cover, long storms, smoke from wildfires-when solar alone may not meet demand. Planning for these moments is part of responsible system design.

    Common backup options include:

    • Small portable gasoline generators for emergency charging

    • Permanently installed propane or natural gas standby generators

    • Community solar or temporary microgrid arrangements

    A hybrid approach works well: solar energy handles day-to-day consumption, batteries smooth out short gaps, and a generator kicks in only during multi-day low-sun periods to recharge batteries. This way, the generator runs infrequently, saving fuel and maintenance costs.

    Serious off-grid designs often assume 2–5 days of low or no sun and size both solar and generator support accordingly. Safety and code compliance matter when tying generators into a solar installation-installation must meet local building and fire safety codes, and local regulations may apply. Professional work beats ad-hoc setups every time.

    11. Costs and Tradeoffs: More Autonomy vs. Higher Investment

    The longer you want to run your house on solar power alone, the more you’ll pay for panels, batteries, and balance-of-system components. The relationship between autonomy and cost is roughly linear for batteries but hits diminishing returns as you pursue total off-grid independence.

    Current pricing benchmarks:

    Component

    Approximate Cost (2026)

    Average cost per watt (residential solar)

    $2.99/watt

    8 kW solar system

    ~$23,920 before incentives

    A typical solar installation

    Over $30,000 for larger systems

    Each 10–15 kWh home battery

    $8,000–$15,000

    The federal solar tax credit is 30 percent of installation costs until 2032, which significantly reduces out-of-pocket expense. The Inflation Reduction Act expanded solar rebates significantly beyond previous levels. State and local incentives vary widely-New Jersey received an A grade for solar incentives, and local incentives may include property tax exemptions that further reduce the effective cost.

    Most homeowners save around $60,000 over 25 years with solar, making even systems with battery storage a strong financial move. But the payback math differs: going solar primarily for bill reduction uses a different optimization than designing for maximum blackout resilience. Solar prices have dropped steadily, and financial incentives continue to make the investment more accessible for potential solar customers.

    Define your goals clearly-bill reduction, outage protection, or full autonomy-before asking a solar company to propose a system size and storage plan.

    12. Financing Options and Ownership: How They Affect Energy Independence

    Financing structure-cash, solar loans, solar leases, or a power purchase agreement-can change how flexible you are in sizing your system for true solar-alone living.

    • Cash or solar loans: Purchasing a system outright gives you full control over panel count, battery size, and upgrades over time. Solar financing through a home improvement loan or dedicated solar loans lets you spread costs while maintaining ownership.

    • Solar leases: Usually focus on predictable monthly payments and bill savings. They may limit oversized arrays or extra batteries needed for long-duration backup. The chosen company typically owns the equipment.

    • Power purchase agreements: You pay for the electricity produced, not the equipment itself. Flexibility for system modifications may be limited.

    Homeowners who value blackout resilience and long solar-only runtimes often prefer ownership rather than leasing, so they can add storage or extra capacity later. Reputable solar companies should walk through payment options alongside technical design, showing how each path affects long-term autonomy and energy savings. Exploring all financing options before committing helps you match the system to both your energy needs and your budget.

    13. Choosing a Solar Company for Reliable, Long-Run Performance

    Accurately answering “how long can my house run on solar power alone?” requires a detailed, site-specific design from a skilled solar installer, not just online calculators. The difference between a well-designed system and a poorly sized one can mean hours versus days of backup.

    Qualities to look for in the best solar companies:

    • Clear engineering-based system sizing with transparent assumptions about sun hours and shading

    • Realistic battery runtime estimates under different load levels

    • Willingness to model winter production and multiple cloudy days

    • Honest answers about what happens to backup runtimes when running air conditioning or electric heating

    • Certified energy practitioners and certified installers on staff, ideally recognized by the North American Board of Certified Energy Practitioners

    Get multiple quotes from local and regional solar companies, comparing equipment brands, warranties, efficiency ratings, and how each solar installer explains how much energy your system will reliably provide each season. Check online reviews and ask for references from past solar panel installations.

    Some companies like Palmetto Solar and other large providers operate across many states, while others focus on specific markets. Both national and local players can design robust, long-running systems when the company operates with quality as its priority. The industry average for system performance ratios runs about 78–80 percent-ask your installer what they assume.

    14. Installing Solar Panels: From Design to Turn-On

    The typical installation process follows a clear sequence, and understanding it helps set expectations for when you’ll actually know how long your system can sustain your home.

    Key steps to install solar panels:

    1. Site visit and shade analysis – Installer evaluates roof condition, orientation, and obstructions

    2. Detailed proposal – Estimating annual kWh production based on your location and roof

    3. Final system design – Panel layout, inverter selection, and battery sizing

    4. Permits and utility approvals – Meeting local codes and interconnection requirements

    5. Installation – Physical mounting of panels, wiring, inverter, and battery (typically 1–3 days)

    6. Inspection – Local authority verifies code compliance

    7. Solar system activation – Utility grants permission to operate; your system goes live

    Accurate answers about how long a home can run on solar must be confirmed after real-world energy monitoring begins. Monitoring apps show daily production versus consumption, giving you hard data instead of estimates.

    High-quality installers will adjust expectations and educate homeowners on realistic runtimes-how long a single battery can power critical loads versus whole-house loads during outages. Work with certified installers and avoid rushing through the installation process, as roof condition, wiring, and panel placement all affect long-term solar performance across solar panel installations.

    15. Going Solar for Homes, Businesses, and Athletic Facilities

    The question of how long a house can run on solar alone extends naturally to similar decisions for small businesses, gyms, and sports performance centers. At Performance Lab of California, we see firsthand how much energy a training facility consumes during peak hours-and how well that demand aligns with peak solar production.
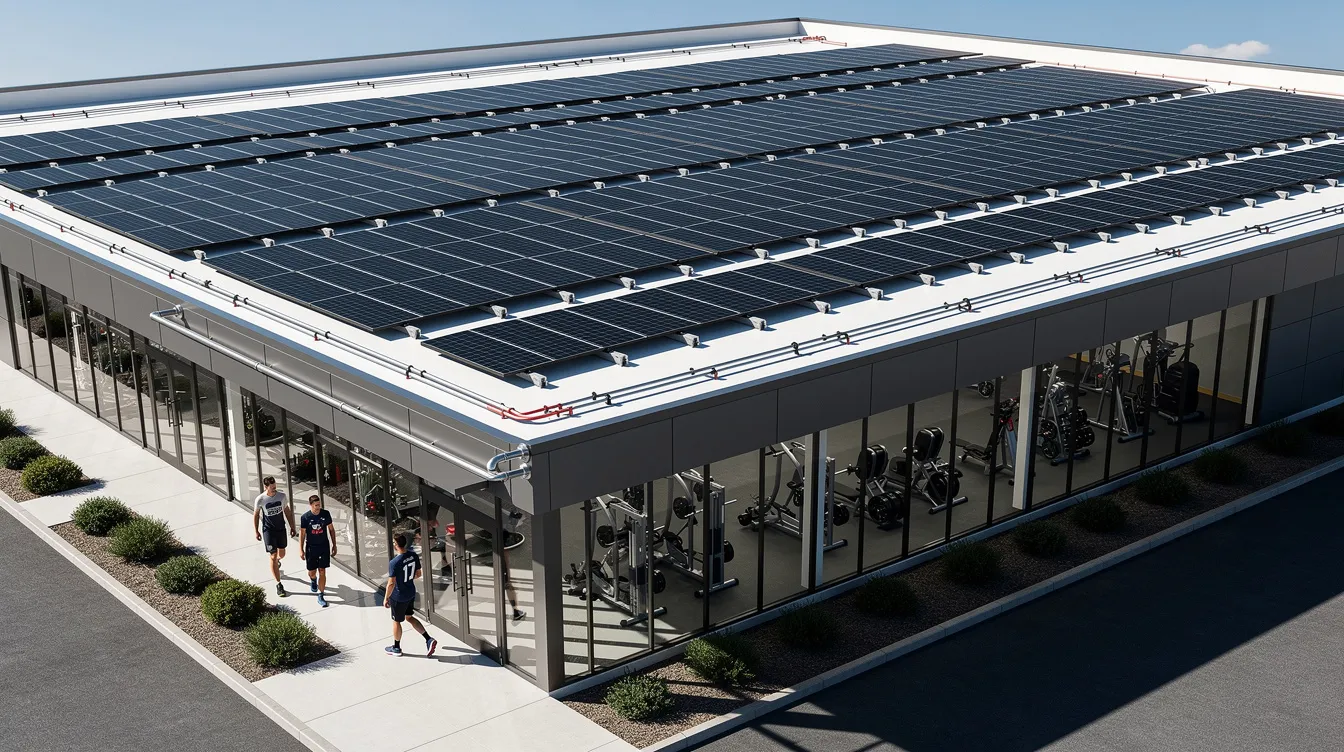
    The image depicts an athletic training facility featuring a flat commercial roof equipped with solar panels installed, harnessing solar energy for sustainable power. This solar panel system contributes to energy savings and provides clean energy, showcasing the facility's commitment to environmentally friendly practices.

    Facilities with high daytime usage-like sports performance centers, corporate wellness spaces, and team training environments-are strong candidates for going solar. Their energy demand lines up almost perfectly with the hours when panels produce the most electricity. A properly sized solar array plus limited battery storage can keep critical systems running during an outage: lighting for athlete safety, basic HVAC, Wi-Fi, and key training equipment.

    Commercial-scale solar installations often combine clean energy with demand management, shifting nonessential loads away from peak times to extend how long they can operate on solar alone. If you manage a team facility, gym, or corporate wellness program, speaking with a solar company experienced in both residential and light commercial solar installation can reveal options you might not have considered.

    16. Is True Off-Grid Living Practical for Most Homes?

    While it is technically possible for many modern homes to run completely off solar power alone, it requires lifestyle adjustments and higher upfront investments than typical grid-tied systems. Achieving 100 percent solar independence relies on several physical, technical, and environmental conditions all lining up.

    Off-grid makes the most sense for:

    • Remote properties where grid connection would cost tens of thousands of dollars

    • Eco-focused cabins designed around minimal energy consumption

    • Resilience-focused homeowners willing to downsize loads and add backup generators

    For suburban homes, staying grid-tied, adding solar energy and a modest battery, and relying on net metering is usually more cost-effective and convenient. A house can be fully powered by solar energy when its electricity generation matches or exceeds household consumption-but for most families, the grid provides a safety net that’s hard to beat on pure economics.

    Fitness, sports training, and everyday life benefit from reliable, predictable electricity. Designing for “smart resilience” rather than absolute isolation is the path most households and facilities choose. The right amount of solar autonomy is a spectrum-from bill reduction to partial backup to full off-grid-and a good solar company can help place your home at the best point on that spectrum.

    17. Summary: Turning the Question Into Your Own Home’s Plan

    The answer to how long can a house run on solar power alone comes down to three numbers: daily consumption (kWh), solar production (kWh per day by season), and usable battery capacity (kWh). When production consistently exceeds consumption and storage covers nighttime and cloudy gaps, the answer approaches “indefinitely.” When any of those three numbers falls short, runtime shrinks accordingly.

    Here’s what to remember:

    • Average homes can often achieve near net-zero yearly electricity use with appropriately sized residential solar systems

    • A single battery usually provides hours to a full day of backup for critical loads

    • Multiple batteries plus oversized arrays are needed for multi-day autonomy

    • Solar panels typically last 25 to 30 years and produce plenty of electricity well beyond warranty periods

    Your next steps: collect your last 6–12 months of utility bills, note your location and roof conditions, and then consult several solar companies for detailed proposals tailored to your actual lifestyle. Prioritize clarity over sales pitches. You should leave every consultation understanding, in plain numbers, how many hours or days your specific design is expected to power your home under different conditions.

    Going solar today means lower utility bills, greater resilience during outages, and a meaningful reduction in your carbon footprint. It doesn’t mean unlimited power in all circumstances-but it does mean taking control of your energy future with real data, proven technology, and a system built for your home. The best time to start is before you need it.

    FAQ: Common Questions About Running a House on Solar Power Alone

    How long can a typical house run on solar power and one home battery?

    For an average U.S. home using about 30 kWh per day, a single 10–15 kWh battery usually supports 8–20 hours of critical loads-lights, refrigerator, outlets, and Wi-Fi-once fully charged by solar panels. The range depends on exactly which appliances you keep running and how efficient they are.

    Running energy-hungry appliances like central air conditioning, electric dryers, or ovens will significantly shorten that window to just a few hours. Exact runtimes must be modeled by an installer based on the home’s real load profile and specific battery brand.

    Can I power air conditioning from solar and batteries during an outage?

    Yes, many systems can run central or mini-split air conditioning from solar and storage, but doing so can quickly drain batteries if the system isn’t sized for that load. A central A/C unit draws 3,000–5,000 watts, which can consume a full battery in just a few hours.

    Strategies that help include raising thermostat setpoints, cooling during midday when solar power output is highest, and using zoned or window units to reduce total draw. If A/C backup is a priority, tell your solar company up front so the design accounts for this energy need from the start.

    What happens if my batteries are empty and it’s still cloudy?

    In a grid-tied system, the home simply pulls power from the utility until the sun returns and recharges the batteries. You barely notice the difference on a day-to-day basis.

    In off-grid setups, an auxiliary generator steps in to recharge the battery bank and keep essentials running during prolonged low-sun events. Planning for 2–5 low-sun days is a common design rule in serious off-grid systems, and most experienced installers build this buffer into their proposals.

    Do I need a battery if my utility offers strong net metering?

    From a pure bill-savings perspective, strong net metering can make solar batteries optional because the grid effectively acts as your storage over time. You export during the day and import at night, with credits offsetting the cost.

    Batteries add value mainly for outage protection, time-of-use rate arbitrage, and resilience-not just for offsetting yearly kWh. Whether backup power and independence from outages justify the added cost of storage depends on your situation, your local grid reliability, and how much peace of mind is worth to you.

    Can I start with solar panels now and add batteries later?

    Many modern inverters and systems are “battery ready,” allowing owners to install solar first and add storage later as needs or budgets change. This phased approach is common among homeowners testing solar for bill savings before investing in larger backup capabilities.

    Ask your solar installer to design with future battery compatibility in mind-choosing inverter models and wiring that won’t need major rework when you add storage. Planning ahead during the initial installation saves significant cost and hassle down the road when you decide to expand your system’s autonomy.
  • Is Solar Worth It in Los Angeles in 2026? (Costs, Incentives, and Payback)

    Is Solar Worth It in Los Angeles in 2026? (Costs, Incentives, and Payback)

    Los Angeles homeowners are asking one question more than ever this year: is solar worth it in Los Angeles in 2026? With the federal residential tax credit now gone and electricity rates still climbing, the math has shifted. This guide breaks down the real costs, remaining incentives, payback timelines, and the key differences between LADWP and SCE customers so you can make a confident decision.

    Key Takeaways

    Solar remains financially attractive in Los Angeles in 2026, especially for homeowners on LADWP rates above roughly $0.30 per kWh. High electricity rates and nearly 300 sunny days per year keep the value proposition strong even without the federal credit.

    • Typical installed solar panels cost about $2.50–$3.25 per watt in L.A. in 2026. A 6–8 kW solar system for a single-family home runs roughly $15,000–$24,000 out of pocket.

    • The 30% federal solar tax credit expired for owner-purchased residential solar systems at the end of 2025. However, Los Angeles residents still benefit from high electricity prices, local incentives, and favorable municipal net metering under LADWP.

    • Many homeowners see a payback period of about 6–9 years and long term savings often exceeding $30,000–$60,000 over 25 years, depending on energy usage and utility.

    • Roof characteristics, electricity usage, and whether your home is served by LADWP versus SCE are the biggest factors affecting whether solar panels pencil out for your household in 2026.

    Is Solar Still Worth It in Los Angeles in 2026?

    For most homeowners with $150 or more per month in electricity bills and decent sunlight exposure, solar is still worth it in L.A. in 2026. The loss of the federal residential clean energy tax credit stings, but it does not erase the underlying economics. Electricity rates in California are among the highest in the nation, and that fact alone drives strong returns for residential solar.

    Here is a quick summary of why solar power still makes sense in Los Angeles:

    • Rates are high. LADWP tiered rates range from roughly $0.26 to $0.41 per kWh depending on tier and season. SCE averages around $0.34–$0.35 per kWh. Those rates are projected to keep rising.

    • Sun is abundant. Los Angeles averages nearly 300 sunny days a year, ensuring high solar output. Properly installed residential solar systems can generate significant electricity throughout the year.

    • LADWP net metering is generous. Customers inside city limits still receive close to retail-rate credits for exported solar energy, keeping payback short without requiring a battery.

    • Returns are weaker for some. Renters, very low-usage households under roughly $60–$80 per month, and heavily shaded properties will see diminished returns. Meanwhile, high-usage homes running AC and EV charging can see very fast payback.

    The short answer is yes, but the details depend on your utility, your roof, and how much electricity you use.

    Average Solar Panels Cost in Los Angeles in 2026

    Los Angeles sits near the lower end of California’s solar prices thanks to mature installer competition, but the total system cost is still a meaningful investment. Average solar panel installation costs about $21,816 for a mid-sized system, and solar panel costs average $3.03 per watt nationally in 2026, while L.A. comes in slightly below that.

    Solar panels cost between $2.69 and $3.19 per watt in the Los Angeles area depending on equipment, installer, and roof complexity. According to EnergySage data, the average price for an installed system in L.A. is about $2.51 per watt before incentives.

    Here are example system cost ranges for 2026:

    • 5 kW solar system: roughly $12,500–$16,000 total cost before local rebates

    • 7 kW solar system: about $17,500–$22,750

    • 10 kW solar system: around $25,000–$32,500

    • 12 kW solar system: a typical 12 kW solar installation costs around $31,135

    The cost per watt is the single best metric for comparing quotes. That figure includes solar panels, inverters, racking, labor, permits, and interconnection. When solar installers charge different amounts, cost per watt lets you compare apples to apples.

    How Solar Costs in Los Angeles Compare to the Rest of California and the U.S.

    Los Angeles solar prices are competitive within California and well below many national markets:

    • California average: about $2.40–$3.25 per watt installed in 2026, depending on equipment tier and region. Central Valley markets tend to run slightly lower due to simpler roofs and lower labor costs.

    • National average: roughly $2.70–$3.60 per watt installed, making L.A. pricing favorable by comparison. (OC Solar reference data)

    Solar installation costs vary significantly by location and system size, but Los Angeles homeowners on LADWP or SCE rates often see better payback than homeowners in cheaper-electricity states, even when the average cost per watt is similar. High utility rates amplify every kilowatt-hour your solar panel system produces.

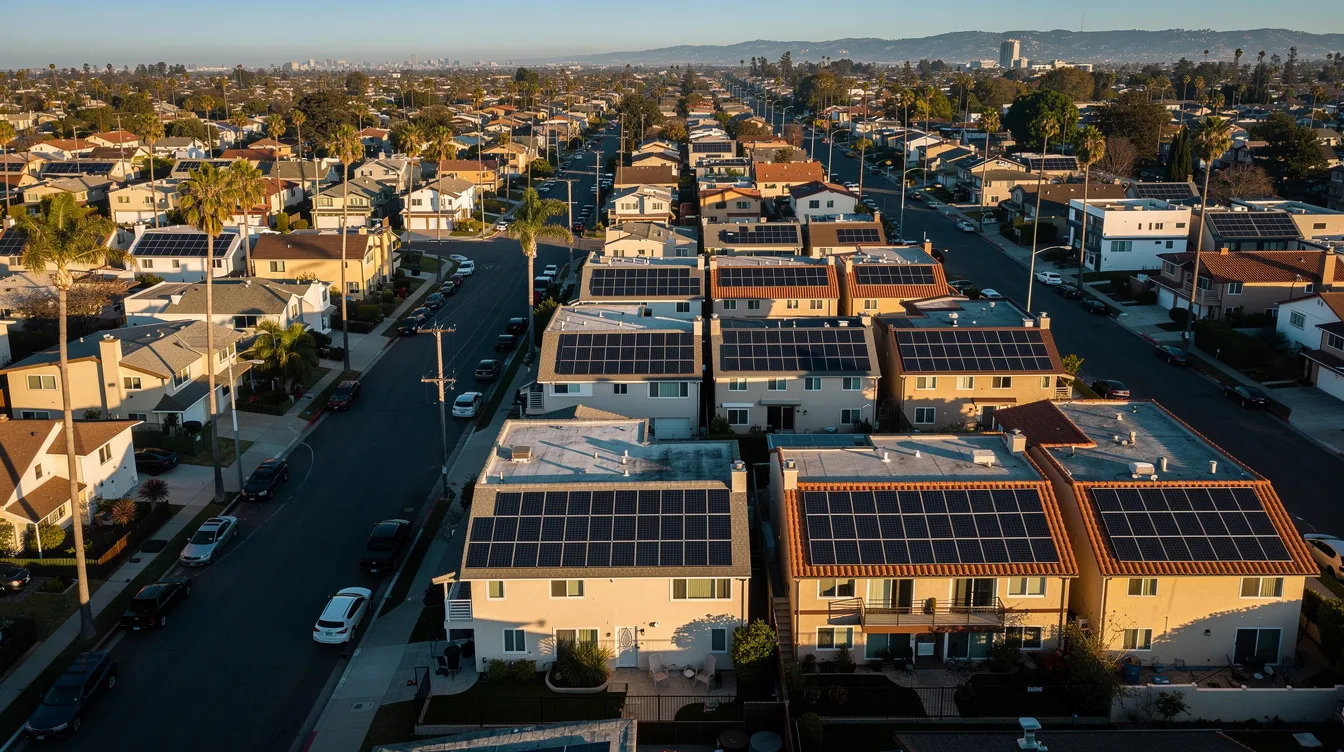
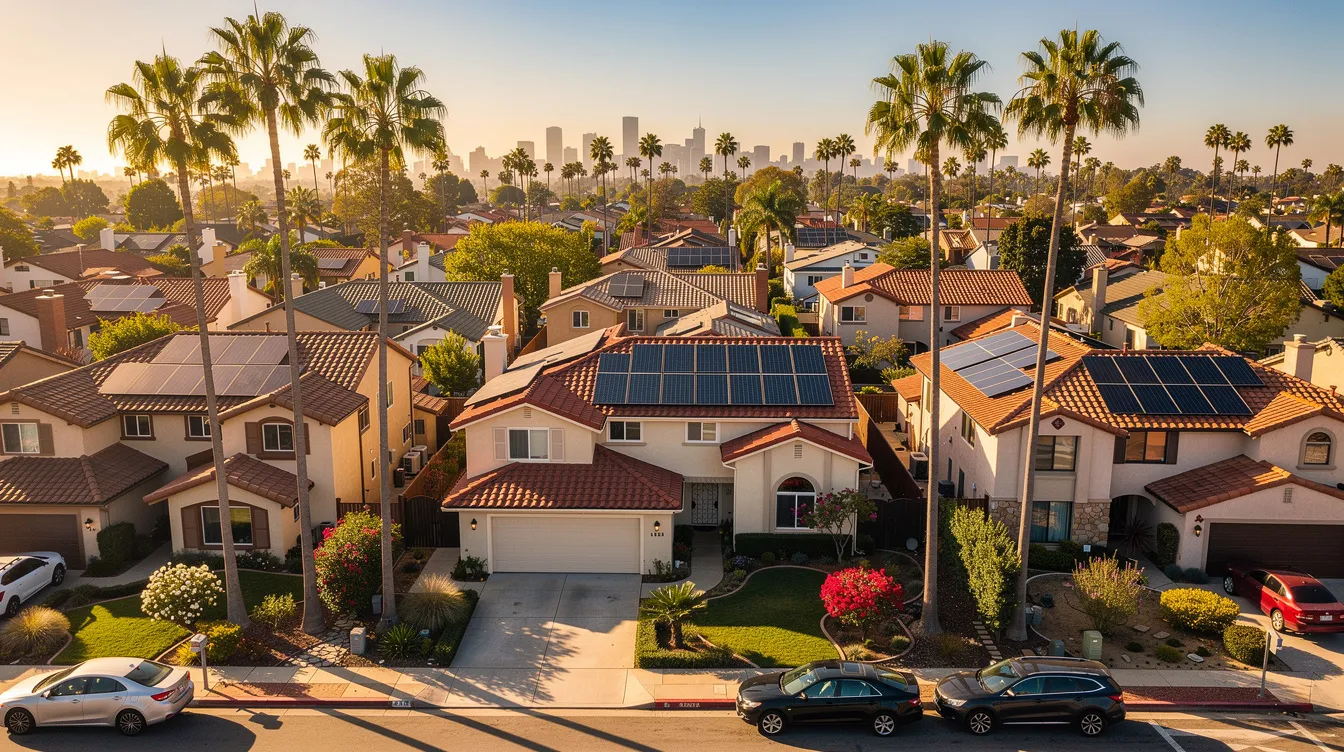
    An aerial view captures a sun-drenched Los Angeles residential neighborhood, showcasing several homes adorned with solar panels and palm trees lining the streets, highlighting the growing trend of solar energy systems in the area. This scene reflects the increasing interest in installing solar panels as homeowners seek to lower their electricity bills and embrace renewable energy.

    Solar Incentives in Los Angeles in 2026 (Post-30% Tax Credit Era)

    The federal solar tax credit is 30% of installation costs-or rather, it was. The federal residential clean energy tax credit expired at the end of 2025, meaning homeowners who purchase and install a residential solar system in 2026 generally cannot claim it. Federal solar tax credits could save homeowners $6,544 on average when they were available, so the loss is significant.

    However, the federal solar tax credit expired for new installations in 2026 only for owner-purchased systems. Third-party owners offering a solar lease or power purchase agreement can still access federal commercial credits under Section 48E, passing some of those savings to customers through lower monthly payments.

    Remaining incentives for Los Angeles in 2026 include:

    • California property tax exclusion. California’s property tax exclusion protects the added home equity value from taxation. Under Revenue & Taxation Code §73, your active solar energy system will not trigger a property tax reassessment if completed by December 31, 2026. This exclusion sunsets January 1, 2027.

    • Self-Generation Incentive Program (SGIP). California’s Self-Generation Incentive Program offers rebates for battery installations, with roughly $280 million budgeted for residential solar and storage equity. Income-qualified and medically vulnerable customers can receive substantial assistance.

    • Local incentive programs. State and local programs can provide additional solar rebates. LADWP occasionally runs limited-time solar or battery rebate programs. Availability changes frequently, so check current LADWP and state websites before committing.

    Incentives can lower solar installation costs by thousands even in the post-federal-credit era. For purchased systems, the property tax exclusion alone avoids an estimated $390 per year in additional property taxes on a typical system.

    LADWP vs. SCE and NEM 3.0: Why Your Los Angeles Utility Matters

    Greater Los Angeles is split among utilities. Most of the City of L.A. falls under LADWP, while surrounding cities like Pasadena (PWP), Glendale (GWP), and many unincorporated areas use SCE. Your utility determines how exported solar power is valued-and that has an outsized impact on your payback period.

    LADWP net metering in 2026:

    • Offers retail-rate or near-retail-rate credits for excess solar energy sent to the grid. Net metering credits you for excess power sent to the grid at close to what you pay for electricity.

    • Batteries are optional. The simpler value proposition means many homeowners skip storage and still achieve a 7–9 year payback.

    SCE under NEM 3.0:

    • NEM 3.0 has reduced export compensation rates for solar energy customers. Export credits are based on an avoided cost calculator rather than retail rates, and they are substantially lower.

    • Batteries are recommended for effective solar economics under NEM 3.0. Storing solar power for use during expensive evening peak hours improves the financial case significantly.

    • Without a battery, payback periods under SCE can stretch to 10–13 years. Adding a battery can compress that to 8–11 years.

    If you live inside LADWP territory, solar-only systems remain cost effective. If you’re on SCE, plan on including a battery in your solar system cost analysis.

    Breakdown of Solar System Cost in Los Angeles

    Most homeowners only see the final price on a quote. Understanding what drives that number helps you spot inflated bids and negotiate confidently.

    For a typical $20,000, 7 kW system in Los Angeles, costs break down roughly as follows:

    • Solar panels: Solar panels represent only 12% of total installation costs. On a $20,000 system, that is roughly $2,400. The panels themselves have become commoditized; the rest of the cost is everything around them.

    • Inverter(s) and electrical balance-of-system: Wiring, combiner boxes, disconnects, and the inverter account for a meaningful share of solar equipment costs.

    • Racking and mounting hardware: Customized to your roof characteristics-flat roofs, tile, and complex multi-plane layouts increase this line item.

    • Labor: Installation crew time, site visits, and roof preparation.

    • Soft costs: Design, permits (through LADBS or regional authorities), inspections, and utility interconnection paperwork.

    • Sales, marketing, and installer margin.

    Common additional equipment or costs:

    • Electrical panel upgrade in older Los Angeles homes: $2,500–$4,500

    • Optional EV charger integration

    • Optional battery storage: $10,000–$18,000 extra depending on capacity and SGIP incentives

    Six Key Factors That Affect Solar Costs for Los Angeles Homes

    Solar costs in Los Angeles are highly individualized. Two homes on the same block can get quotes that differ by thousands. Here are the six factors that matter most.

    1. Energy usage

    Monthly kWh consumption is the main driver of required system size. A home averaging 900 kWh per month might need roughly 7–8 kW of installed solar, while 450 kWh per month might only require 4–5 kW. Investing in solar energy requires evaluating electricity consumption and utility rates before sizing a system.

    2. System size

    Larger solar systems cost more overall but generally have a lower average cost per watt due to economies of scale. The average system size in L.A. is close to 8–10 kW. Larger systems spread fixed costs like permitting and interconnection across more watts.

    3. Solar equipment

    Solar panel efficiency ranges between 15% and 20% on average. Monocrystalline solar panels with higher efficiency produce more energy per square foot, which matters when roof space is limited-a common situation on Los Angeles bungalows. Equipment choices between microinverters versus string inverters also affect cost. String inverters are cheaper upfront, while microinverters offer better performance under partial shading and panel-level monitoring.

    4. House and roof characteristics

    Installation costs vary based on roof complexity and sunlight exposure. Asphalt shingle roofs are cheapest and fastest for solar panel installation. Tile roofs, common across L.A., often require special mounts or a “comp-out” overlay.

    5. Location on the lot

    Solar production declines due to shading from trees or neighboring buildings. Coastal areas like Santa Monica or Venice deal with marine layer that reduces morning production, while inland neighborhoods like Northridge and Pasadena get more direct sunlight exposure.

    6. Installer

    Different Los Angeles solar installers quote different labor rates, equipment brands, and warranty terms. Get at least three detailed, per watt quotes. Be cautious of any solar company offering prices below about $2.40 per watt installed with vague line items-hidden costs often surface later.

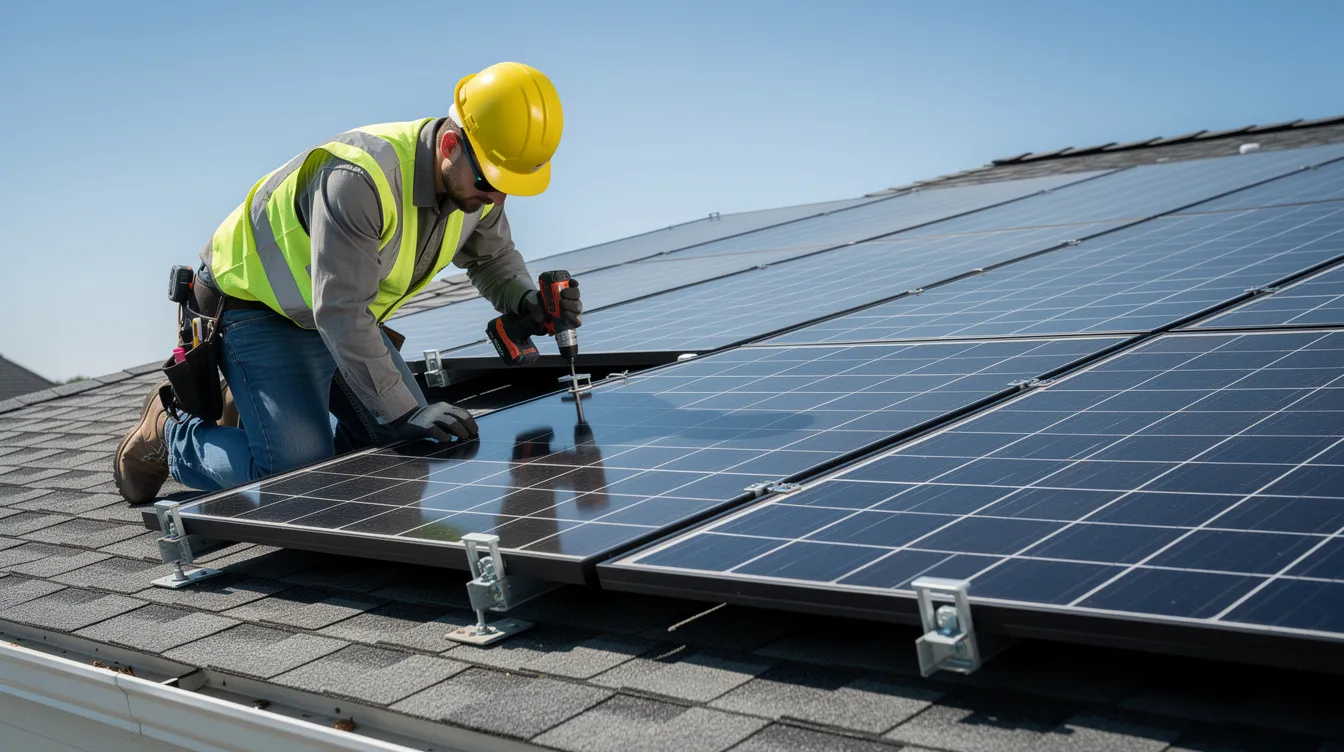
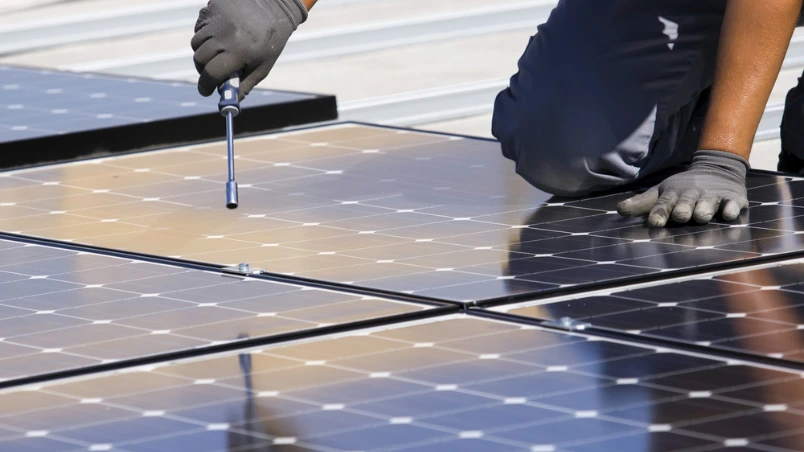
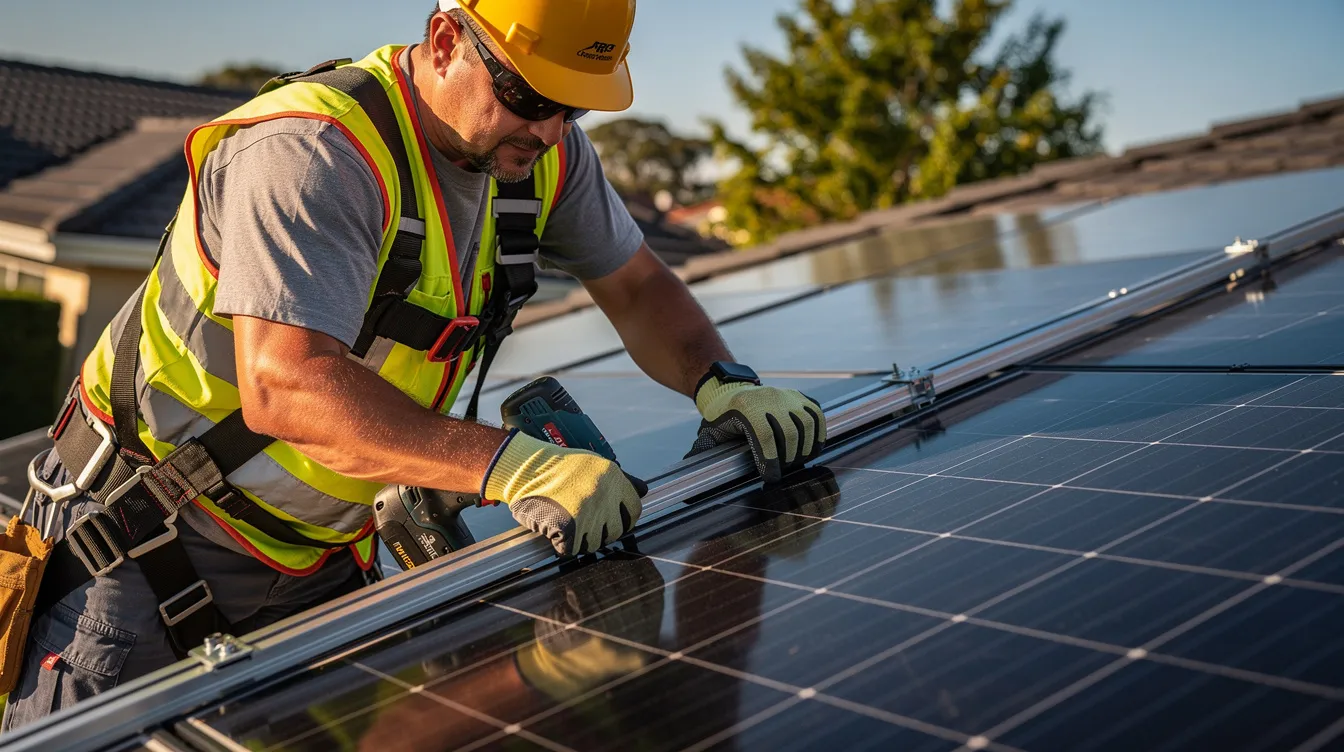
    A close-up image shows a worker carefully installing solar panels on a residential rooftop under a clear blue sky, highlighting the growing trend of solar energy systems for homeowners. This solar installation emphasizes the importance of solar power in reducing energy costs and promoting renewable energy.

    Payback Period and Long Term Savings in Los Angeles

    The payback period is the time it takes for electricity bill savings to equal your initial solar system cost. Solar panels can start saving money in year one, and a solar payback period averages about 10 years nationally. In Los Angeles, the picture is often better.

    2026 payback estimates:

    • LADWP customer with a $220 per month electric bill installing a 7 kW solar system for roughly $20,000: expect a 6–8 year payback. Annual savings of approximately $2,000–$2,600 per year.

    • SCE customer under NEM 3.0 without a battery: payback stretches to 9–12 years. Adding a battery and optimizing time-of-use behavior compresses this to roughly 8–11 years.

    Long term savings:

    • Over 25 years, homeowners save $41,000 to $155,000 depending on system size, utility, and rate escalation. Average monthly savings range from $72 to $289.

    • Many Los Angeles households realistically save $30,000–$60,000 or more, even after accounting for solar panel maintenance and inverter replacement.

    • Solar panels generate free electricity for decades. Most carry 25-year performance warranties, and many continue producing meaningful output well beyond that.

    • High energy independence protects against utility rate hikes. LADWP and SCE have both raised rates consistently over the past decade.

    Quick example: A $19,250 system producing $2,400 per year in bill savings pays for itself in about 8 years. Over the remaining 17+ years of panel life, that is roughly $40,000+ in avoided energy costs-and more if rates keep climbing.

    House and Roof Characteristics That Make Solar Work Best in Los Angeles

    Los Angeles sun is abundant, but the roof ultimately determines how many solar panels fit and how efficiently they perform.

    Ideal conditions:

    • South- and west-facing roof planes with minimal shading and a tilt of about 15–30 degrees

    • Single-story homes with simple rooflines and asphalt shingles-easiest and cheapest for installing solar panels

    • According to real-world production data, south-facing roofs with 20-degree tilt in L.A. can approach 1,690 kWh per kW per year under ideal conditions

    Challenging conditions:

    • Spanish tile roofs common in older neighborhoods like Silver Lake and Hancock Park often require extra mounting hardware, increasing installation costs

    • Heavy shading from mature trees or neighboring multi-story buildings can reduce production significantly and lengthen the payback period

    • Fewer panels fit on complex multi-plane roofs, sometimes requiring premium higher efficiency modules to meet electricity needs

    Roof age:

    Consider roof replacement if the roof has fewer than 10–12 years of life remaining. Removing and reinstalling solar panels for panel replacement during a future reroof costs $2,000–$5,000 extra. Combining roof work and solar into one project adds cost upfront but saves more money over time.

    Solar Panel Maintenance, Lifespan, and Reliability in Los Angeles Climate

    Los Angeles’ dry climate is generally easy on solar equipment, but dust, smog, and occasional wildfire ash can create a film that slightly reduces production.

    Solar panel maintenance:

    • Professional cleaning in 2026 runs about $150–$300 per visit, typically needed no more than once per year

    • DIY rinsing is an option on single-story roofs with safe access; use a garden hose in the early morning

    Common repairs:

    • Inverter replacement after 10–15 years: often $1,500–$3,500 depending on type and system size

    • Occasional wiring or monitoring fixes, usually covered under installer workmanship warranty in early years

    Lifespan:

    • Most modern solar panels carry 25-year performance warranties, guaranteeing around 80–88% output at year 25

    • Many arrays installed in Southern California in the early 2000s are still operating, demonstrating real-world longevity well beyond warranty periods

    Annual solar panel maintenance costs are relatively low and should be factored into long term savings calculations, but they rarely come close to erasing the financial benefit.

    How to Pay for Solar in Los Angeles in 2026

    Your payment method affects both total solar costs and how quickly you break even. Here is how the three main options compare.

    Cash purchase:

    • Lowest total cost over the life of the solar system-no interest payments, full eligibility for any remaining local incentives

    • Cash purchases provide the best long-term savings for solar

    • Best suited for homeowners who can invest $15,000–$30,000 as an upfront cost and plan to stay at least 5–7 years

    Solar loan:

    • Solar loans typically have a 20-year repayment term with interest rates varying by credit score and lender

    • Solar loans can increase total costs by 43% over the life of the loan compared to cash, so compare interest payments carefully

    • Many loans are structured so the monthly payment is near or below the pre-solar monthly electric bill, creating predictable monthly payments from day one

    Solar lease and power purchase agreement (PPA):

    • Solar leases require no upfront payment and include maintenance

    • In 2026, third-party owners of a solar lease or PPA can still claim federal commercial tax credits under Section 48E, which they use to offer lower rates to customers

    • Tradeoffs: no system ownership, no property value increase, but low or zero upfront cost

    • Buying solar panels outright provides more long term savings, but a solar lease or PPA makes clean energy accessible if cash or credit is limited

    Compare each option on total lifetime cash outlay and long term savings-not just the monthly payment.

    A homeowner is seated at a kitchen table, examining electricity bills while using a laptop that displays various solar quotes, highlighting the potential costs and benefits of installing a solar energy system. The image emphasizes the growing interest in solar panels as a cost-effective solution for reducing monthly electric bills and energy costs.

    Step-by-Step: Estimating Your Solar Costs and Savings in Los Angeles

    Rather than relying on a generic online calculator, use this simple five-step framework with your own numbers.

    Step 1 – Gather data: Pull 12 months of LADWP or SCE bills to find your average monthly kWh and current rate per kWh. Note your total annual electricity usage.

    Step 2 – Estimate system size: In sunny Los Angeles, many homes need about 1 kW of solar for every 350–450 kWh of monthly usage, depending on roof orientation and shading. A home using 800 kWh per month needs roughly 6–7 kW. Homes needing fewer panels can sometimes fit a system on a single roof plane.

    Step 3 – Apply cost per watt: Multiply your estimated system size (kW × 1,000) by a mid-range cost per watt (e.g., $2.75 per watt). A 7 kW system: 7,000 × $2.75 = $19,250 approximate solar installation cost.

    Step 4 – Estimate bill savings: Multiply your average monthly electric bill by a realistic reduction percentage. Under LADWP net metering, a well-sized system can offset 70–90% of your bill. If your bill is $200 per month, that is $140–$180 per month in savings, or $1,680–$2,160 per year.

    Step 5 – Calculate payback: Divide estimated system cost by estimated annual savings. $19,250 ÷ $1,920 = roughly 10 years. Remember, rising utility rates in Los Angeles will often shorten real-world payback versus a static-price estimate. The National Renewable Energy Laboratory provides additional production modeling tools if you want more precision.

    Is Solar Right for Your Specific Los Angeles Home? (Decision Checklist)

    Not every home is an ideal candidate for home solar systems. Before requesting quotes, run through this checklist.

    • ☐ Current monthly electric bill consistently above $120–$150

    • ☐ Roof in good condition with 10+ years of life left, or you are willing to reroof soon

    • ☐ Enough unshaded, south- or west-facing roof area for solar panels

    • ☐ Plans to stay in the home at least 5+ years

    • ☐ Willingness to consider financing options if cash is not available

    • ☐ Verified whether your utility is LADWP or SCE (net metering vs. NEM 3.0 affects payback)

    • ☐ Comfortable that solar energy reduces the household’s carbon emissions as a secondary benefit

    If you check most of these boxes, solar is likely a strong investment. Obtain at least three detailed quotes from licensed solar installers, verify warranties and projected payback, and compare the final price on a per watt installed basis before signing.

    FAQ

    These FAQs address common Los Angeles-specific questions not fully covered above.

    Do solar panels increase home value in Los Angeles in 2026?

    Solar panels can increase a home’s resale value significantly. Research from Lawrence Berkeley National Laboratory has shown that owned solar panel systems tend to add several thousand dollars to a home’s sale price, roughly proportional to remaining system value. In Los Angeles’ high-rate utility market, buyers view solar as an attractive feature because of lower electricity bills. Note that solar leases and PPAs do not add owned asset value-they require lease transfer approval and may not increase resale price.

    Is it better to add a battery with solar in Los Angeles in 2026?

    For LADWP customers, batteries are optional. They mainly provide backup power during power outages and some bill optimization under time-of-use rates. Solar panels provide backup power during outages when paired with battery storage, which is their primary appeal on the LADWP grid. For homeowners under SCE and NEM 3.0, batteries are more compelling because they let you store solar energy for use during expensive evening hours, improving payback. SGIP incentives can significantly reduce the additional equipment cost for qualifying customers.

    Can I install solar panels on a rental or multi-unit property in Los Angeles?

    Landlords and multi-family property owners can install solar panels, but they should consider virtual net metering or separate meters depending on building type and utility rules. Tenants typically cannot install rooftop solar without landlord approval, but they can sometimes subscribe to community solar or green power programs. California also legalized plug-in balcony solar for residential use, providing a small-scale option for apartment dwellers. Check LADWP or your relevant utility’s specific guidelines for multi-unit and rental properties.

    Will Los Angeles get new solar incentives after 2026?

    Solar incentives frequently change at the state and federal level, and there is ongoing policy discussion about extending or replacing credits. Waiting for potential future tax credits can mean missing out on years of savings at today’s high electricity rates. It also means missing the California property tax exclusion, which sunsets January 1, 2027. Treat incentives as a bonus rather than the sole reason to go solar, and check the latest information on state and LADWP websites when you are ready to move forward.

    What if I plan to buy an EV-does that change whether solar is worth it?

    Adding an electric vehicle can significantly increase electricity usage, making a larger solar system more valuable. An EV charging at home might add 300–400 kWh per month to your energy costs, which means more electricity to offset and often a shorter payback period for the combined investment. Size your solar system with that additional load in mind, especially if you will be charging during daytime hours when panels produce more energy. Pairing solar with smart EV charging can maximize use of daytime production and further reduce your dependence on grid electricity.

  • Solar Installation in Southern California: Steps and Timeline

    Solar Installation in Southern California: Steps and Timeline

    Installing the panels is one stage of a solar project, not the entire process. A Southern California installation also involves design, approvals, inspection, and utility authorization. The schedule for your home depends on what the site needs and how each approval proceeds.

    Rather than relying on a single promised completion date, ask for a milestone schedule showing the responsible party and current status at every stage. That makes it easier to identify what is complete and what is holding up the next step.

    1. Electricity review and initial assessment

    Gather 12 months of electricity use, your utility rate name, and any plans for an electric vehicle, heat pump, or other new loads. Explain whether your priority is electricity costs, backup power, or both. Ask the provider to document the goals it is designing around.

    At this stage, a preliminary estimate should be clearly distinguished from a final site-approved scope. Ask which assumptions could change after the survey and what would happen if the property needs roof or electrical work.

    2. Site survey and design

    The installer evaluates the roof, shade, electrical equipment, and proposed equipment locations. If batteries are included, the design should explain capacity, backup scope, and the equipment required for the intended operation. Ask for the final layout and equipment schedule before approving substitutions or revisions.

    The Department of Energy’s consumer walkthrough describes solar as a series of decisions and installation steps. Your own project schedule should identify which design findings could affect cost or timing.

    3. Permit and utility paperwork

    Local permits and utility interconnection are different approval processes. The Department of Energy explains that local governments generally require permits before rooftop installation and inspect completed work. Requirements depend on the jurisdiction and project.

    Ask who submits each application and who follows up on corrections. A Los Angeles County project should use the actual authority responsible for the property, rather than assuming every address follows the same city process. Apply the same approach in Riverside and Ventura counties.

    4. Installation and any additional work

    Once the applicable approvals and prerequisites are in place, the crew installs the equipment under the agreed scope. Confirm site access, expected interruptions, equipment placement, cleanup, and the point of contact. Ask whether roof repairs, electrical upgrades, or other prerequisite work are complete before the crew is scheduled.

    A scheduled installation appointment does not establish when the utility will authorize operation. Have the provider distinguish physical installation, inspection, and operational approval in every timeline update.

    5. Inspection, corrections, and permission to operate

    The completed work proceeds through the required inspection and utility review. SCE states in its Solar Billing Plan application FAQs that incomplete documents can trigger a deficiency notice and that final approval leads to permission to operate. Its stated processing expectations depend on the request type; paired storage and other complex projects can require additional review.

    Ask for the inspection result, any correction list, and the utility application status. The installer should identify whether it is waiting for a document, a technical review, a meter-related step, or a correction to completed work. Follow the installer’s and utility’s approved instructions for activation.

    6. Activation, monitoring, and handover

    After authorization and commissioning, request access to monitoring and a demonstration of the system. Collect the final equipment list, warranties, inspection records, operating instructions, and service contact details. If backup is included, have the installer explain which circuits are supported and how reserve settings work.

    Keep the first utility statements and monitoring reports. Ask the installer how to compare the reporting periods and whom to contact about unexpected results. Production, household consumption, imports, and exports are different measures; a good handover explains what each screen shows.

    A simple way to track the schedule

    • Design: approved, awaiting survey, or awaiting revision?
    • Permits: submitted, approved, or corrections requested?
    • Prerequisite work: what is needed, and who owns it?
    • Installation: scheduled or complete?
    • Inspection: passed, scheduled, or awaiting corrections?
    • Utility authorization: submitted, under review, or issued?
    • Handover: monitoring access, documents, and demonstration complete?

    Frequently asked questions

    How long does solar installation take from start to finish?

    There is no single reliable timeline for every home. Request a project-specific estimate covering design, prerequisite work, permitting, installation, inspection, and utility review, with dependencies identified.

    Can I turn on solar immediately after installation?

    Do not treat physical completion as authorization. Follow the approved activation instructions and confirm the required local and utility approvals.

    Who should update me if the project is delayed?

    Ask for one named project contact who can identify the current milestone, outstanding task, responsible party, and next update date.

    Explore our solar and battery guide and FAQs before beginning your project.

    Want to understand the options for your property? Request a free solar assessment. Los Angeles Solar Advisory helps homeowners in Los Angeles, Riverside, and Ventura counties explore solar options through consultations representing Axia by Qcells. Your proposal should reflect your home, utility, and contract terms.

  • How Much Do Solar Panels Cost in Los Angeles in 2026?

    If you’re a Los Angeles homeowner weighing solar in 2026, the landscape has shifted. The federal tax credit for purchased systems is gone, electricity rates keep climbing, and the gap between a good deal and a bad one is wider than ever. This guide breaks down exactly what residential solar panels cost in LA right now, where the money goes, and how to make sure you’re not overpaying.

    Key Takeaways

    • In 2026, typical installed residential solar in Los Angeles costs about $2.10–$3.00 per watt, with California Solar Quotes per year translating to roughly $13,000–$32,000+ for most homes depending on system size. These figures reflect total installation cost before any local incentives and with no 30% federal tax credit, which expired for homeowner-owned systems after December 31, 2025.
    • LADWP customers maintain favorable net metering arrangements compared to SCE customers under NEM 3.0, so payback periods for many city of LA residents land in the 6–9 year range even without the federal credit. Your electric bill size and roof characteristics are the two biggest variables that swing long term savings.
    • Panels themselves represent only about 10–20% of total panels cost. Electrical work, permitting, labor, and soft costs drive the bulk of what you pay for installing solar panels in Los Angeles.
    • Financing choice matters more than ever in 2026. A cash purchase usually provides the best long-term savings, while a solar loan can increase total costs by 43% or more due to interest payments and dealer fees. Solar leases and power purchase agreement structures still exist but involve trade-offs around ownership and property value.
    • Customized quotes are essential in LA because shading, roof age, roof complexity, and which utility serves your home can dramatically change the final price and payback period.
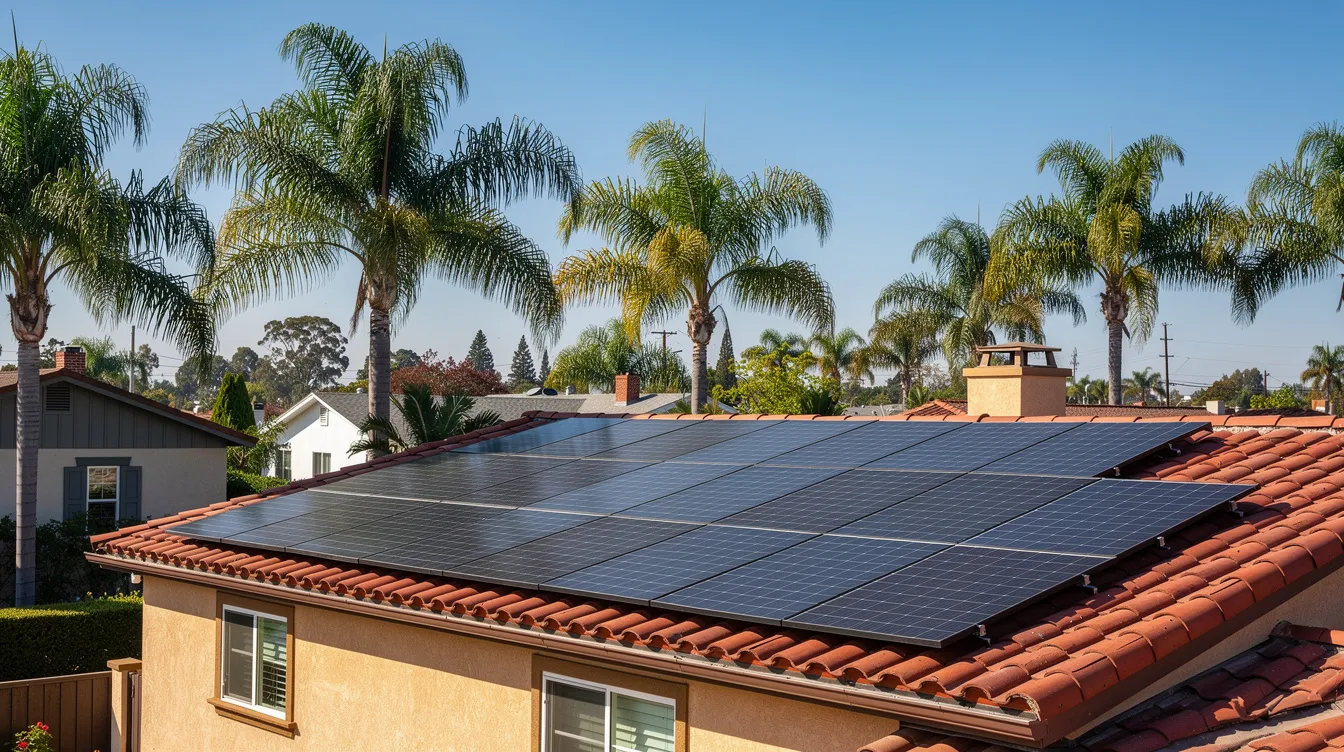
    A residential rooftop solar panel array is installed on a Spanish-style home in Los Angeles, surrounded by palm trees and set against a clear blue sky, showcasing a modern solar energy system designed to reduce electric bills and provide free electricity. The image highlights the integration of solar panels into the architecture, emphasizing the growing trend of solar installation in sunny climates like Los Angeles.

    Current Cost of Solar Panels in Los Angeles in 2026

    Here’s the direct answer: residential solar panels in Los Angeles average $2.10 to $3.00 per watt installed in 2026. Compared to what LADWP charges which is above $4.40 per watt. According to EnergySage marketplace data, the average system runs about $2.51 per watt for a roughly 9.85 kW average system size, putting the gross price at approximately $24,700 before incentives. Solar panel costs vary by location due to labor differences, and LA sits slightly above the broader California average because of higher labor rates and permitting overhead.

    To put this into practical terms:

    • A 5000 kW system at $2.80–$3.20 per watt costs about $14,000–$16,000
    • An 8000 kW system runs about $20,000–$26,000
    • A 7,200 kW solar panel system costs $21,816 before incentives at the national average of about $3.03 per watt

    These prices assume a turnkey solar installation – solar equipment, design, labor, permits, and utility interconnection included. They do not include a 30% federal tax credit because the expiration of the federal residential clean energy tax credit affects solar installation costs starting 2026.

    Los Angeles solar pricing is influenced by both city and county building departments, with some variance across jurisdictions. Quotes below about $2.00 per watt in LA are uncommon and may be red flags for missing scope or hidden costs.

    What Solar Costs Per Watt in Los Angeles vs California Overall

    Cost per watt is the single best metric for comparing solar quotes. It normalizes everything – different system sizes, roof types, equipment brands – into one number that ties directly to energy output and long term savings. Comparing installation costs by price per watt is advisable for homeowners evaluating multiple quotes.

    Here’s how LA stacks up in 2026:

    Market

    Typical Cost Per Watt

    Los Angeles

    $2.10–$3.00

    California statewide (avg $21,235)

    $2.00–$3.05

    National average

    $2.70–$3.60

    Dense urban labor markets, higher permitting overhead, and more complex roofs in older LA housing stock push LA’s cost per watt slightly above statewide averages. Solar panels cost about $2.60 per watt before incentives nationally in 2026, while OC Solar reports $2.50–$3.50 per watt for California.

    Typical LA price ranges by situation:

    • Larger systems (10–13 kW), simple roof: ~$2.50–$2.70 per watt installed
    • Mid-size (6–8 kW), standard roof: ~$2.70–$3.25 per watt
    • Small systems (≤5 kW) or systems adding batteries: often above $3.30 per watt

    While “cost per square foot of roof” sometimes appears in conversations, per watt remains far more reliable because it connects directly to how much electricity your system will produce.

    Example System Prices for Los Angeles Homes

    Let’s convert per-watt solar pricing into full system price examples for common LA home scenarios. These focus on residential solar, not commercial.

    • Small 4 kW system (low-usage home or apartment-style property): ~$11,200–$13,000 total price
    • Typical 6–7 kW family home: ~$16,800–$22,400 total cost
    • Large 10 kW system (home with pool, EV charger, or heavy AC): ~$26,000–$32,000
    • 12 kW solar panel installation: costs approximately $31,135 in 2026
    • Adding a battery (Tesla Powerwall 3 or equivalent): adds roughly $10,000–$14,000 to any system above. Battery storage integration can significantly increase the initial cost of solar installations.

    These examples assume standard roof characteristics – asphalt shingle, 1–2 stories, moderate slope, minimal shading. Complex roofs or tile materials push costs higher.

    At Performance Lab of California, we’re not solar installers – but we work with athletes and active families across LA who care about managing their monthly payment obligations smartly. We encourage clients to compare these system size examples against their actual electric bill to estimate the real cash-flow impact.

    An aerial view of a Los Angeles residential neighborhood showcases multiple homes equipped with rooftop solar panels, highlighting the growing trend of solar energy systems in urban areas. This installation not only contributes to free electricity but also reflects the increasing interest in solar panels as a financial investment for homeowners looking to reduce their electric bills.

    How the Federal Solar Tax Credit Changed for 2026

    Here’s the biggest shift for 2026: the federal solar tax credit is 30% of installation costs – but only for systems installed through December 31, 2025. The 30% Residential Clean Energy Credit under Section 25D expired for homeowner-owned systems after that date. Homeowners save an average of $6,545 from the federal tax credit – but only if their system was placed in service before the cutoff.

    Systems physically completed and placed in service in 2025 may still claim 30% on 2025 tax returns, even if some paperwork wraps up in early 2026. That’s different from projects that start construction in 2026.

    Federal support now primarily flows through the commercial 48E credit, which benefits third-party owners of solar assets. This means a solar lease or power purchase agreement can still indirectly pass savings to LA homeowners through lower monthly rates – but you won’t claim a tax credit yourself.

    Many online solar pricing calculators are outdated in 2026 because they still automatically subtract 30%. LA homeowners should calculate payback without assuming this credit unless they’re entering a lease or PPA arrangement. Consult a tax professional before making assumptions about your personal eligibility, but budget as if there is no federal residential credit for purchased systems.

    Los Angeles-Specific Incentives and Utility Programs

    Even without the 30% federal credit, Los Angeles residents benefit from state incentives, local incentive programs, and utility offerings that reduce the cost of solar and improve long term savings. Local incentives can reduce solar costs by hundreds or thousands of dollars. While states like Massachusetts, New Jersey, and Washington D.C. offer top incentives nationally, LA has its own advantages.

    Property tax exclusion: California still excludes active solar energy systems from property tax reassessment. Adding solar panels won’t trigger higher property taxes – significant in high-value LA neighborhoods where solar rebates directly lower the upfront cost of installations.

    LADWP net metering: LADWP’s program credits homeowners for excess solar generation at near-retail rates, which is considerably more favorable than the introduction of California’s Net Billing Tariff (NEM 3.0), which impacts solar credit value for excess energy exported to the grid under investor-owned utilities like SCE. This difference alone can shave years off your payback period.

    SGIP rebates: Income-qualified customers in LA County can access Self-Generation Incentive Program rebates that substantially reduce battery costs for backup power, making storage more affordable. Demand for home battery systems has increased due to lower export compensation values under NEM 3.0.

    Solar incentives and program budgets can change yearly. Verify current LADWP, SCE, and state-level offerings at the time of installing solar panels.

    Cost Breakdown: Where the Money Goes in an LA Solar Quote

    Solar panels themselves are only a fraction of the total cost of solar. Understanding the cost breakdown helps you spot inflated quotes and hidden costs.

    Key line items in a typical Los Angeles solar quote:

    • Solar panels (modules): Often around 10–20% of total system cost. Choosing high-efficiency solar panels can raise material costs for installations, but high-quality solar panels may improve long-term performance and energy production.
    • Inverters, racking, and wiring: String inverters tend to be less expensive than microinverters. This solar equipment package typically represents another 10–20%.
    • Labor: Installation costs for installing solar panels include safety measures on tall or steep LA roofs. Complex roofs drive this up significantly.
    • Permitting, plan review, inspections: Permitting and installation fees can significantly affect overall solar project costs. Fees vary between the City of LA and surrounding municipalities.
    • Electrical panel upgrades: Older homes may require electrical panel upgrades for solar systems. Many LA homes have 100-amp service; upgrades commonly add $2,500–$4,500.

    Premium solar equipment can increase installation costs by 25% compared to standard-tier panels and inverters, but the trade-off is often higher annual production and longer warranty coverage.

    Soft costs – sales commissions, design, engineering, overhead – can form 30–40% of the price in the LA metro due to higher wages and compliance requirements. These are real expenses, but they’re also where the biggest variation between quotes tends to appear.

    Hidden Costs to Watch for in Los Angeles Solar Projects

    Reputable installers are transparent, but many homeowners still encounter hidden costs that affect the real system cost and long term savings.

    Common items to watch for:

    • Roof repairs or replacement required before installing solar panels, especially on 20+ year-old roofs. Removing and reinstalling panels later doubles labor costs.
    • Upcharges for tile, metal, or flat roofs – common in Los Angeles architecture and frequently underquoted.
    • Structural engineering sign-off for older hillside or seismic-risk homes, which can add several hundred to over a thousand dollars.
    • Trenching or conduit runs for detached garages or ADUs, a frequent layout in LA neighborhoods.

    Financing-related hidden costs deserve special attention. Dealer fees can add 20% to 50% to financed solar costs, even when the monthly payment looks attractive on paper. These fees inflate the apparent cost per watt and aren’t always disclosed clearly in initial proposals.

    Insist on a written, line-item cost breakdown and ask what happens if extra electrical or roof work is discovered after the project starts. Transparent, up-front planning reduces surprises and leads to a smoother, more predictable payback period.

    How Roof Characteristics Affect Solar Panel Cost in Los Angeles

    LA’s mix of flat roofs, clay tile, and older multi-plane designs has an outsized impact on panels cost compared to simpler suburban layouts in other regions. Complex roof designs increase installation labor costs meaningfully.

    Complex roofs with many planes, skylights, or dormers increase labor time and racking hardware, often adding $0.20–$0.40 per watt to the cost per watt of installing solar panels. This is where fewer panels on a simpler roof can actually save more money than trying to maximize coverage on a difficult one.

    South-facing or southwest-facing roofs with minimal shading from palm trees and neighboring buildings can use fewer panels to offset the same electric bill, lowering total cost and improving payback. Conversely, shaded or east/west-oriented roofs may require more panels or highest efficiency modules to reach the same annual production, increasing cost and potentially requiring multiple roof surfaces.

    Ask your installer for a shading and production report – tools like Aurora or Helioscope model each roof surface so you can see exactly how roof characteristics drive the cost of solar and energy output.

    A close-up view of solar panels installed on a clay tile roof, typical of Southern California residential architecture, showcasing the integration of solar energy systems into home design. This image highlights the modern approach to energy efficiency and the potential for homeowners to reduce their electric bills through solar installation.

    Electric Bills, Usage, and System Size in Los Angeles

    System size is the single biggest driver of cost of solar. Factors that influence solar costs include system size and energy needs – and that size is determined by electricity usage across a full year, not by square footage alone. System size impacts total solar installation costs significantly.

    Typical LA homes use 6,000–10,000 kWh per year. But higher electricity usage requires more solar panels installed – homes with pools, EVs, or extensive air conditioning can exceed 12,000–15,000 kWh annually, meaning they need more panels and a larger solar energy system.

    A useful rule of thumb: many LA rooftop systems produce about 1,300–1,600 kWh per installed kW per year, depending on orientation and shading. Dividing your annual usage by this range gives an initial target system size.

    Rising Southern California electric rates – often $0.30–$0.40 per kWh for higher usage tiers – make offsetting more electricity from the grid increasingly valuable. But a bigger system also means a bigger upfront cost.

    Gather 12 months of electric bills before getting quotes so installers can accurately size systems and estimate a realistic payback period.

    Long-Term Savings and Payback Period for Los Angeles Solar

    Even without the 30% federal tax credit, high LA electric rates keep the typical payback period in the 6–9 year range for many homeowners with good sun exposure. The average payback period for solar panels nationally is about 10 years, but LA’s high rates and strong sunshine improve on that for well-designed systems.

    How payback works in practice:

    • A ~$20,000 cash system saving ~$2,200 per year has a ~9-year simple payback
    • A similar system under a low-interest loan might add 1–2 years but still produces 15+ years of net savings after payoff

    Solar panels typically last 25 years or more, and they generate free electricity for decades after the system pays for itself. Homeowners save $41,000 to $155,000 over 25 years, and most homeowners earn back installation costs several times over.

    LADWP-served homes often see faster payback than SCE-served areas because export credits sit closer to retail rates, making every extra kilowatt-hour of more electricity produced more money in your pocket.

    Financing Options in 2026: Cash, Loans, Leases, and PPAs

    How you pay can change the effective cost per watt and long term savings as much as the hardware you choose. Here’s how the major options compare as a financial investment in 2026:

    Option

    Upfront Cost

    Lifetime Cost

    Ownership

    Cash purchase

    Highest

    Lowest

    Full

    Solar loan

    $0–low down

    20–43% higher

    Full

    Solar lease

    None

    Moderate

    Third party

    Power purchase agreement

    None

    Varies

    Third party

    Cash purchase: Highest upfront cost but lowest lifetime cost of solar. Clearest path to a shorter payback period and full control over equipment and warranties. Cash purchases usually provide the best long-term savings.

    Solar loan: $0-down options are common in LA. The average monthly payment for a solar loan is $130.31, but solar loans can increase total costs by 43% due to interest payments and dealer fees. Compare APR, term length, and total paid over time – not just the monthly payment.

    Solar lease / PPA: Solar leases require no upfront payment for installation. These structures may still benefit from the 48E credit at the corporate level, potentially offering cost effective monthly rates. But you don’t own the system, and you won’t see property value benefits.

    Request both cash and financed quotes to see the full picture of how each option impacts monthly cash flow, ownership, and long term savings.

    Choosing an Installer and Evaluating Quotes in Los Angeles

    LA’s mature solar market means many homeowners get competitive quotes, but quality and transparency vary. Getting multiple quotes – at least 2–3 – is the single best way to protect yourself.

    Every LA solar quote should clearly include:

    • System size in kW and expected annual production in kWh
    • Total price and cost per watt, separated by cash vs. loan offers
    • Equipment brands and models (panels, inverters, racking)
    • Roof layout and any required electrical or roof upgrades

    Verify contractor licenses with the California State License Board. Pay attention to reviews that mention communication, change orders, and support during permitting – these are where problems typically surface in business operations.

    Question any bids that fall significantly below or above typical LA ranges without clear explanation. Ask how the installer models future rate increases for LADWP or SCE when estimating payback period, as this dramatically affects projected savings and can reveal whether their numbers are realistic or aspirational.

    How Solar Fits into a Performance & Wellness Lifestyle in Los Angeles

    At Performance Lab of California, we focus on helping athletes and active families across LA build sustainable, high-performance routines. Solar ownership fits that same philosophy – planning ahead, reducing financial stress, and investing in a home environment that supports consistent training.

    Stable, lower electricity costs from residential solar make it easier to:

    • Run home gyms, treadmills, and recovery devices without watching the electric bill spike
    • Keep indoor environments at optimal temperatures for sleep and recovery, even during heat waves
    • Charge EVs used for commuting to training sessions, leveraging solar production instead of peak utility rates

    Consider a Los Angeles family with two young athletes: they run AC for recovery, charge an EV for practice commutes, and power a garage gym. Without solar, summer bills can hit $350+. A properly sized solar system turns that into a predictable, low-cost line item – freeing up more money for training, nutrition, and the things that actually move performance forward.

    Installing solar panels aligns with a long term wellness mindset: reducing uncertainty, investing in your environment, and setting up systems that pay dividends for decades.

    A person is exercising on a rowing machine in a bright home gym, where sunlight streams through large windows, creating a warm and inviting atmosphere. The scene emphasizes the importance of a healthy lifestyle, similar to how a solar energy system can provide free electricity and long-term savings for homeowners.

    FAQ: Solar Panel Costs in Los Angeles in 2026

    How much do solar panels cost per watt in Los Angeles in 2026?

    Most reputable residential solar quotes in Los Angeles fall between about $2.50 and $3.40 per watt in 2026, depending on system size, roof complexity, and equipment choices. Smaller systems and complex roofs tend to push cost per watt higher, while larger, straightforward projects land toward the lower end. Be cautious of offers far below $2.40 per watt – they may omit important elements like electrical upgrades, permits, or quality solar equipment, and should be treated as red flags until the scope is verified.

    Is there still a 30% federal solar tax credit for Los Angeles homeowners in 2026?

    No. The 30% Residential Clean Energy Credit (Section 25D) ended for homeowner-owned systems installed after December 31, 2025. New purchased systems in 2026 do not qualify. Solar leases and PPAs may still benefit indirectly from the commercial 48E credit, with savings passed to customers as lower monthly payments rather than a tax credit you claim yourself. Consult a tax professional for your specific situation, but budget as if there is no 30% credit on a 2026 purchase.

    How long is the typical payback period for solar in Los Angeles now?

    Most LA homeowners with good sun exposure and average-to-high electricity usage see payback periods of about 6–9 years in 2026. Properties served by LADWP or other municipal utilities often see faster payback than those on SCE because export credits are more favorable. Look at both simple payback and total 25-year savings when evaluating whether solar fits your financial goals – the long-horizon view is where solar becomes genuinely cost effective.

    Do I need to replace my roof before installing solar panels in Los Angeles?

    Roofs with less than about 8–10 years of remaining life typically should be repaired or replaced before installation to avoid paying removal and reinstallation costs later. Many LA homes have older tile or flat roofs that require extra preparation, adding to hidden costs if not addressed upfront. Ask your installer and, if needed, an independent roofer to assess roof condition. Any recommended work should appear in the project’s cost breakdown before you sign.

    Are solar batteries worth the extra cost in Los Angeles?

    Adding a typical 10–15 kWh battery in LA in 2026 usually costs an additional $10,000–$14,000 installed, significantly increasing the upfront cost. Batteries make the most sense for homes with frequent outages, steep time-of-use evening rates, or residents who rely on powered medical devices or work-from-home setups needing backup power. For many homeowners, a battery is a resilience and comfort upgrade rather than a purely financial decision – its value depends on how much you prioritize uninterrupted power versus minimizing initial cost of solar. New Hampshire and other states with different rate structures may see different battery economics, but in LA the calculation is primarily about reliability and peak-rate avoidance.

  • How Much Do People Save Switching to Solar in 2026?

    If you’ve been watching your electricity bills climb year after year, you’re not alone. Millions of homeowners across the U.S. are asking the same question: how much do people save switching to solar? The answer depends on several factors, but the short version is that going solar in 2026 remains one of the strongest long-term financial moves a homeowner can make, even after recent changes to federal incentives.

    Key Takeaways

    Most homeowners who install solar panels in 2026 can expect to save between $37,000 and $154,000 over 25 years on electricity bills, depending on location, usage, and system size. The national average sits around $60,000 in lifetime solar savings for a typical rooftop solar system purchased with cash, based on current electricity prices and a panel lifespan of 25 to 30 years. Homeowners typically save between $1,000 and $2,000 per year on energy costs once their system is operational.

    Payback time is usually 7 to 12 years in sunny, high-cost states like California or Hawaii, but can stretch longer where power is cheaper or incentives are limited. Rising electricity rates, which have increased by about 2.8% annually over the past decade, are a major reason why going solar today often beats staying with the utility. To understand exactly how much you can save with solar in your specific situation, compare personalized quotes that factor in system size, incentives, and financing. Enter your zip code on a reputable quote platform to see solar prices near you.

    The image depicts a white house with orange solar panels mounted on the roof, surrounded by two green trees, all set on a light blue platform in a sunny suburban neighborhood. This home represents the potential for energy savings and lower electricity bills through a solar panel system, highlighting the benefits of renewable energy and the investment in solar technology.

    How Much Do Solar Panels Really Save the Average Homeowner?

    A typical 12 kW rooftop solar system in the U.S. can save around $60,000 to $70,000 over 25 years after system cost, according to EnergySage marketplace data. Residential solar power can lead to significant long-term financial savings because your annual electricity bills without solar would keep rising, while a paid-off solar panel system produces low-cost solar energy for decades. A standard residential solar system can reduce electricity costs by 50% to 90%, and solar panels can reduce or eliminate monthly electricity bills entirely.

    Here’s how savings differ by household profile:

    • A modest user in a moderate-rate state (roughly 10,000 kWh per year at about 17 cents per kWh) can expect approximately $50,000 to $70,000 in lifetime savings.
    • A high user in a high-rate state like California (14,000+ kWh per year at 33 cents per kWh) could see savings climb past $100,000, sometimes reaching $150,000 or more.
    • In a low-rate state like Washington (around 14 cents per kWh), lifetime savings might land closer to $40,000 to $50,000.

    These figures assume the homeowner owns the system, uses most of the energy produced on-site, and has at least average sun exposure.

    What Determines How Much You Can Save by Going Solar?

    Your potential solar savings depend on several factors: your current electric bill, local electricity rates, rooftop solar potential, installation cost, available incentives, and how you choose to finance the system. Local electricity rates influence the amount of savings homeowners can achieve from solar, and solar savings depend on installation costs and energy usage.

    Higher electricity bills today generally translate into larger total energy savings over 20 to 25 years. Your roof matters too: south facing roofs with a tilt of roughly 15 to 40 degrees produce the most energy in the U.S. Shading from trees or neighboring buildings can cut output significantly. System size also plays a role. Larger systems cost more upfront but offset a greater share of your electricity needs if your usage is high enough.

    How Your Solar Installation Cost Affects Savings

    Solar panel system cost is typically quoted in dollars per watt. In 2026, national residential averages land in the mid-$2 per watt range before incentives. Solar installation costs vary by system size and equipment quality, and solar costs are generally lower in warm states than cold states due to simpler roof work and competitive installer markets.

    Concrete examples:

    • A 6 kW solar panel system might cost around $15,000 to $18,000 before incentives.
    • A 10 to 12 kilowatt kW solar panel system typically runs in the upper $20,000s to low $30,000s.

    System cost depends on panel efficiency, inverter choice, roof complexity, and installer labor rates. Lower upfront costs shorten payback time, but very cheap equipment can reduce performance and eat into long-term savings. High initial costs are a barrier to solar adoption for some homeowners, which is why you should see solar prices from several reputable installers, compare system designs, and weigh warranties and service quality, not just the sticker price.

    How Much You Pay for Electricity Now (and Why It Matters)

    Your current electricity rate and monthly usage are the strongest predictors of how much you can save by switching to solar. A typical U.S. household uses around 10,000 to 11,000 kWh per year. At roughly $0.18 to $0.22 per kWh in 2026, that adds up to $2,000 or more per year in utility bill costs, according to EIA data.

    Electricity rates increase by about 2.8% annually. Electricity prices historically increase over time, making solar cost-effective for long-term savings. Over 20 to 25 years, those compounding increases mean the grid power you avoid buying becomes increasingly expensive, while how much electricity your panels produce stays relatively steady.

    In places with high utility rates like parts of California, New England, or Hawaii, solar can sometimes cut lifetime energy costs by well over $100,000 for heavy users. Pull out a recent electric bill, look at your kWh rate and monthly average, and you’ll start to visualize your own immediate savings potential.

    A close-up view showcases solar panels connected to a modern inverter system, being installed on the roof of a single-story home. This rooftop solar installation represents an investment in renewable energy, aiming to lower energy costs and provide homeowners with significant solar savings on their utility bills.

    How Incentives, Tax Credits, and Net Metering Boost Savings

    Federal, state, and local incentives can significantly reduce the initial cost of installing solar. The federal solar energy credit is a tax credit for solar systems; however, the 30% residential Investment Tax Credit expired for new installations after December 31, 2025. Many states offer incentives for rooftop solar customers through rebates, property-tax exemptions, or performance-based payments. State tax credits can lower solar payback periods significantly. The Database of State Incentives for Renewables & Efficiency lists upfront incentives available in your area.

    Net metering programs allow homeowners to receive credits for excess solar energy fed back to the grid. When your solar panels produce more than you use, excess electricity is sent to the utility and you earn credits that reduce future electricity bills. Some areas now use net billing or time-varying export rates where credits may be worth less than full retail, slightly reducing savings but still making solar attractive. In states with strong net metering, payback time can shorten by several years compared with a no-incentive scenario.

    How You Pay for Your Solar Panels: Cash, Loans, and Other Options

    Your financing structure changes both monthly cash flow and total lifetime solar savings. Financing options include cash, loans, leases, or PPAs. Here’s how they compare:

    • Pay cash: Highest upfront costs but maximum lifetime savings. Cash purchases typically have a payback period of about 10 years, with no interest eating into returns.
    • Solar loans: Fixed-rate loans spread system cost over 5 to 20 years. Monthly loan-plus-electricity payments can be similar to or lower costs than your previous utility bill, delivering day-one savings for many homeowners.
    • Leases and PPAs: A power purchase agreement lets you save money without owning the solar system. Little or no upfront cost and immediate savings on your electric bill, but generally lower total lifetime returns since a third party owns the panels.

    Compare scenarios side by side, looking at monthly payments, payback period, and total 25-year savings before deciding.

    Estimating Solar Payback Time and Long-Term ROI

    Payback time is the number of years it takes for your cumulative annual savings on electricity bills to equal the net cost of your solar panel system. The average payback period for residential solar systems is typically 7 to 10 years. Without incentives, the average payback period is about 10 years, or more precisely about 10.1 years.

    A simple example: if your net system cost after incentives is $22,000 and your estimated annual savings are $2,200, your payback time is roughly 10 years. The financial benefits of solar need to be evaluated against the initial investment costs to confirm the math works for your situation.

    Once you pass payback, the remaining 10 to 15 or more years of panel life are essentially profit years of free electricity, where the energy produced is dramatically cheaper than grid power. Think of solar as a long-term investment in your home, not just a gadget purchase. The average solar installation payback period is about 10 years, after which you’re effectively earning a return that outpaces many traditional savings vehicles.

    Beyond Money: Environmental and Lifestyle Benefits of Going Solar

    While most homeowners go solar to save money, the environmental impact and energy independence are meaningful bonuses. A typical residential solar system can offset tens of tons of CO₂ over 25 years, comparable to planting thousands of trees or removing multiple cars from the road. Adopting solar energy helps protect homeowners from fluctuations in electricity prices, giving more predictability in household budgeting.

    Potential additional savings can come from battery storage paired with solar panels. A home battery storage unit mounted on the exterior wall surrounded by two green trees might not sound glamorous, but it keeps essential loads running during grid outages. Pairing rooftop solar with a battery storage unit mounted alongside your system adds resilience, especially in regions with wildfire or storm-related blackouts.

    A person stands in front of a white house with orange solar panels on the roof, holding a personalized checklist or energy plan that represents a customized solar and energy assessment for their home on a sunny day. This image highlights the potential for solar savings and energy independence for homeowners considering installing solar panels.

    FAQ: Common Questions About How Much You Can Save With Solar

    How much can most homeowners expect to save on their electric bill with solar?

    Most homeowners who properly size a rooftop solar system to match their usage can reduce monthly electricity bills by 60% to 100%. Some customers still pay small fixed charges to the utility, but their variable electricity costs drop dramatically once panels on the roof start producing power. Over 25 years, homeowners save between $37,000 and $154,000 depending on their rate, usage, and state.

    Does solar still make sense if I don’t use a lot of electricity?

    Savings are smaller when usage is low because there’s less expensive grid electricity to replace, so payback can take longer. Low-usage homeowners should focus on modestly sized systems designed to offset a reasonable portion of their load. Environmental benefits may be a bigger motivator than pure financial return in these cases.

    What happens to my savings if electricity prices go down instead of up?

    While short-term price dips can happen, long-term utility rates have historically trended upward. If rates rose more slowly than expected, total lifetime savings would be lower than projections, but owning a paid-off solar system still provides inexpensive power and insulation from future rate spikes.

    Do solar panels still save money if my utility reduced net metering?

    Less generous export credits lower the value of excess solar sent back to the grid, so oversized systems become less profitable. Consider sizing your system closer to on-site consumption and possibly pairing it with a customized solar and energy storage setup so more renewable energy is used directly in your home at full retail value.

    Will installing solar panels increase my home’s resale value?

    Solar panels can increase home value by 5% to 10%, according to multiple studies over the last decade. Buyers value lower future electricity bills. Leased systems can also be attractive, but buyers and lenders may review the lease or power purchase agreement terms carefully. Keep documentation organized for a smooth sale process.

  • Do Solar Panels Work During a Power Outage? Battery Guide

    Do Solar Panels Work During a Power Outage? Battery Guide

    Most ordinary grid-tied solar systems do not keep a home powered during a utility outage. To provide backup, a system needs equipment and controls designed for operation while safely separated from the grid. Panels on the roof alone are not a backup-power plan.

    For homeowners considering outages or planned shutoffs in Southern California, the starting point is a list of things you want to keep running. That list is more useful than choosing a battery by brand or headline capacity.

    Why solar can shut down when the sun is out

    A conventional grid-connected system is designed to stop supplying power when the grid fails. SCE describes this behavior in its solar maintenance guidance. A backup design must manage the transition and isolate the home appropriately. Ask the installer to explain the outage configuration in writing.

    A battery installation is not automatically a backup installation

    Energy storage can be configured for different purposes. Some designs focus on shifting energy use while the grid is available. Others include backup equipment and selected circuits. As one manufacturer example, Tesla documents both backup and non-backup configurations for certain systems. Confirm the exact equipment and configuration in your own proposal.

    Request a clear answer to three questions: Does this system operate during an outage? Which circuits receive power? Can the solar array recharge the battery while the utility is down? Do not infer the answers from the presence of a battery icon in a sales presentation.

    Battery capacity and power answer different questions

    Kilowatt-hours (kWh) describe stored energy. Kilowatts (kW) describe the rate at which equipment can supply power. A design can have enough energy for several hours yet lack the power needed to start a particular appliance. The Department of Energy’s storage overview explains the distinction between storage capacity and power.

    For an arithmetic example, suppose 8 kWh is available for backup after your reserve and operating limits. At an average 0.5 kW load, 8 ÷ 0.5 equals 16 hours. At 2 kW, the same calculation gives 4 hours. These are simplified examples, not product-runtime promises; losses, changing appliance use, temperature, and system limits affect actual performance.

    Make an essential-load list before sizing

    • Refrigerator and freezer: identify their actual consumption and starting needs.
    • Internet equipment, phones, and a few lights: list the devices you need.
    • Garage doors and gates: ask whether their circuits are included.
    • Air conditioning, pumps, or electric cooking: ask for a specific power and runtime assessment.
    • Any critical equipment: discuss its requirements and an appropriate contingency plan with the relevant professional.

    Ask the designer to distinguish equipment that can run individually from equipment that can run simultaneously. “Whole-home backup” also needs a practical explanation of load management. It does not establish that every appliance can run together for an unlimited period.

    Balance everyday use with outage reserves

    A household using stored energy every evening may have less available when an unexpected outage begins. Ask how the reserve setting works and what happens during extended cloudy weather. For a multiday outage, request a scenario that shows daytime generation, essential loads, and overnight energy needs together.

    Also identify who will commission the system, demonstrate the app, and provide support. Before accepting the project, ask for a walkthrough of the backed-up circuits and the installer’s approved operating instructions.

    Frequently asked questions

    Can I add a battery to existing solar?

    Sometimes, but compatibility and the existing installation matter. Have a qualified installer review the inverter, electrical equipment, utility requirements, and proposed backup configuration.

    Can a battery run central air conditioning?

    Possibly. The answer depends on the air conditioner’s starting and running demand, other simultaneous loads, and the system’s power rating. Ask for a written design assessment.

    Will solar recharge a battery during an outage?

    Only if the installed system supports that operation under the conditions at the time. Confirm this feature for the proposed design, along with any operating limits.

    Explore our solar and battery options or visit the FAQ page for related questions.

    Want to understand the options for your property? Request a free solar assessment. Los Angeles Solar Advisory helps homeowners in Los Angeles, Riverside, and Ventura counties explore solar options through consultations representing Axia by Qcells. Your proposal should reflect your home, utility, and contract terms.

  • Is My Roof Good for Solar? A California Homeowner Checklist

    Is My Roof Good for Solar? A California Homeowner Checklist

    A roof is a good solar candidate when its condition, usable space, sunlight, and structure support a practical design. A sunny address alone does not establish that a particular roof is ready. The most useful assessment examines both energy production and the work needed to install the array.

    For Los Angeles, Riverside, and Ventura County homeowners, begin with information you can gather safely from records and ground-level observations. A qualified professional should handle roof access, structural evaluation, and installation planning.

    Start with condition and remaining life

    Find the roof’s installation date, material, repair history, and any warranty documents. Note known leaks or recent damage. Age is a starting point, not a pass-or-fail rule: materials, maintenance, and actual condition matter. The Department of Energy advises considering roof age and the time until replacement when evaluating solar.

    If replacement may be needed soon, obtain a roofing assessment before finalizing the solar project. Ask for written findings and identify who is responsible for any repairs. Do not treat a satellite drawing or a salesperson’s visual impression as a structural or roofing report.

    Understand the cost of roof work after solar

    A later roof project may require removing and reinstalling panels. The EPA identifies roof condition and the possibility of array removal during future replacement as important planning considerations. Before proceeding, ask which company would handle that work and how its cost would be determined.

    Compare two written scopes if necessary: solar on the existing roof, and roof work completed before solar. Include any added coordination and warranty responsibilities. The comparison should make visible the work you are doing now and the work you may be deferring.

    Look at shade across the proposed array

    Trees, chimneys, nearby buildings, and roof features can affect available sunlight. Ask for a shade analysis showing which roof planes are productive and which are constrained. A roof that looks sunny at noon may have a different morning or afternoon pattern.

    Avoid assuming that trimming or removing trees is part of a proposal unless it is written into the scope and appropriately approved. If a design depends on future vegetation changes, request a second production scenario without those changes. That makes the dependency easier to evaluate.

    Roof direction is one input, not the whole design

    Orientation and tilt affect production, but the best available layout depends on the property. Ask the designer to explain the expected output for each roof plane rather than presenting one county-wide average. Compare projected energy and installation cost for alternative layouts where practical.

    A professional assessment also needs to address structural capacity and electrical service. Pacific Northwest National Laboratory’s assessment guidance includes roof covering, structural capacity, array orientation, and electrical service considerations. Your local permit requirements and site-specific findings determine the final design.

    Usable roof area is smaller than total roof area

    A large roof does not mean every square foot can hold panels. Ask for a layout that identifies roof equipment, obstructions, and required access or clearance areas. Have the installer explain the applicable requirements rather than estimating panel count from an aerial roof area alone.

    If a battery is part of the project, ask about its proposed location at the same time. The equipment location, access, electrical route, and installation requirements belong in the scope review before a final commitment.

    Bring these items to the roof assessment

    • Roof installation date and available warranty records.
    • A list of known leaks, repairs, and planned roof work.
    • Existing plans or structural information, if available.
    • A clear description of shade concerns and nearby obstructions.
    • Questions about roof penetrations, waterproofing, and service responsibilities.
    • Any homeowner association documents relevant to the project.

    Frequently asked questions

    Do I need a new roof before solar?

    Not always. Ask a qualified roofer and the solar designer to evaluate the actual condition and remaining service life, then compare the practical timing of both projects.

    Can solar go on a tile roof?

    The material alone does not answer whether your home is suitable. Ask for a material-specific mounting plan, an assessment of the roof, and clear responsibility for any damage or repairs.

    Can a partly shaded roof still work?

    Possibly. Request a design and production estimate that explicitly account for the shade. Compare the output and cost of the affected roof planes.

    For the next design questions, explore our solar panel options and homeowner FAQs.

    Want to understand the options for your property? Request a free solar assessment. Los Angeles Solar Advisory helps homeowners in Los Angeles, Riverside, and Ventura counties explore solar options through consultations representing Axia by Qcells. Your proposal should reflect your home, utility, and contract terms.

  • How Many Solar Panels Do I Need? A Southern California Guide

    How Many Solar Panels Do I Need? A Southern California Guide

    The number of solar panels you need depends on your electricity use and your roof’s expected production. Square footage alone cannot answer the question. Two homes of the same size may use very different amounts of electricity because of air conditioning, electric vehicles, pool equipment, or occupancy.

    For a useful first estimate, collect 12 months of electricity use in kilowatt-hours. Then ask a designer to model your actual roof. A monthly dollar bill can start a conversation, but it does not replace usage data.

    Step 1: Add your annual electricity use

    Find the kWh used on each electricity statement and add the last 12 months. Keep electricity separate from gas, water, and other services. If your home already has solar, utility purchases alone do not show total household consumption; the existing system’s production and self-consumption need review.

    For illustration, a home averaging 800 kWh monthly uses about 9,600 kWh annually. Do not assume the same amount every month: summer cooling and seasonal changes can make a monthly average hide important patterns. Download interval usage when available so the proposal can address timing as well as totals.

    Step 2: Estimate the production of the proposed roof layout

    A solar array’s rated size is measured in kW; its electricity output over time is measured in kWh. A production model combines the array size with roof direction, tilt, weather, shading, and losses. PVWatts provides preliminary generation estimates, while a site-specific design should evaluate the actual property.

    Ask for the model inputs. A shaded roof in a Los Angeles neighborhood and an unobstructed roof in Riverside County should not automatically use the same production assumption. Even adjacent roof planes can perform differently.

    Step 3: Convert system size into a panel count

    Here is a simplified example using assumptions, not a production forecast: suppose the goal is 9,600 kWh annually and the modeled annual yield is 1,500 kWh for each installed kW. Dividing 9,600 by 1,500 gives a 6.4 kW array. If each proposed panel is rated at 400 watts, 6,400 watts divided by 400 watts equals 16 panels.

    If the assumed yield were instead 1,200 kWh per kW, the same annual target would imply an 8 kW array, or 20 panels at 400 watts each. This example shows why a panel-count estimate without a production assumption is incomplete. Actual equipment sizes and available layouts will change the design.

    Step 4: Include realistic changes to your household

    • Electric vehicle: estimate annual driving, vehicle efficiency, and the share charged at home.
    • Heat pump or electric water heater: ask for a documented annual-use estimate.
    • Pool equipment: review actual schedules and consumption.
    • Efficiency improvements: account for planned changes that could reduce demand.
    • Household changes: discuss additional residents or extended work-from-home schedules.

    Separate confirmed plans from possibilities. Ask for a current-use design and a future-use scenario with each added load shown. This makes it easier to see what you are paying to accommodate. Confirm any utility sizing requirements before approving a larger array.

    Why 100% annual offset does not mean a zero bill

    Producing the same annual kWh that your home consumes does not mean production and use occur together. A home may export midday electricity and import at night. Remaining charges and the applicable export-credit rules affect the bill. Compare projected imports, exports, and any storage operation rather than treating annual offset as a savings guarantee.

    Frequently asked questions

    How many panels does a 2,000-square-foot house need?

    There is no reliable panel count based only on floor area. Use annual electricity consumption, a roof production model, and the wattage of the proposed panels.

    Should I cover every available roof surface?

    Not automatically. Ask the designer to compare the extra cost and expected production of additional panels, especially on shaded or less productive roof planes.

    Does adding a battery reduce the number of panels I need?

    A battery stores energy; it does not create it. Its charging needs, losses, and intended use should be included in the system model.

    Explore solar panels and battery storage and our solar FAQs before reviewing a layout.

    Want to understand the options for your property? Request a free solar assessment. Los Angeles Solar Advisory helps homeowners in Los Angeles, Riverside, and Ventura counties explore solar options through consultations representing Axia by Qcells. Your proposal should reflect your home, utility, and contract terms.

  • How to Compare Solar Quotes in California: 12 Questions

    How to Compare Solar Quotes in California: 12 Questions

    Compare solar quotes by matching the system, assumptions, and contract scope before comparing the monthly payment. A low payment can describe a different system, a longer commitment, or a proposal that leaves out work another bid includes.

    A useful quote review should leave you with a clear picture of what will be installed, who is responsible for it, and what you will pay. Use the following questions to organize proposals for your Southern California home.

    1. Are the proposals solving the same problem?

    Write down your priorities: reducing utility purchases, adding outage backup, preparing for an electric vehicle, or a combination. Ask each provider to design around the same usage records and priorities. A backup-focused project should not be compared with a solar-only bid as if the scopes were identical.

    2. What equipment and rated size are included?

    Request panel quantity, panel wattage, inverter model, and total DC array capacity. Confirm the exact models in the final equipment schedule. Product names alone do not establish a system’s size or output.

    3. What annual production is modeled, and why?

    Ask for the production estimate plus roof orientation, shade assumptions, and modeled losses. Ask what changes after the site visit. If two proposals predict different output from similar arrays, have each provider explain the difference rather than choosing the larger number.

    4. Which utility plan does the bill estimate use?

    Confirm the utility, rate schedule, export-credit treatment, and any generation provider. Ask whether the comparison includes remaining electricity purchases and fixed charges. A county name is not a tariff, and an annual production total is not a complete bill model.

    5. What is the complete price for the same scope?

    Request itemized pricing for panels, inverters, storage, backup equipment, permitting, and electrical work. For a purchase, compare a written cash price with financing terms separately. For a lease or power purchase agreement, ask for the payment schedule, term, and escalation provisions. Review our solar financing overview alongside the actual documents.

    6. Is price per watt being used fairly?

    For a simple purchase example, $24,000 divided by an 8,000-watt solar array equals $3 per watt. That arithmetic is useful only after you identify what the price includes. Do not use a solar-only price per watt to judge a package containing a battery, a roof project, or major electrical work.

    7. Does the battery scope include outage backup?

    Request usable energy capacity, power ratings, backed-up circuits, and any required control equipment. Ask the designer to show what can operate simultaneously. A battery listed on the proposal does not, by itself, define the outage performance.

    8. Which costs remain uncertain?

    Ask about roof repairs, electrical upgrades, trenching, permit revisions, and equipment substitutions. Request the change-order process and identify which findings could change the price. A clear allowance is easier to evaluate than a verbal promise that additional work will probably be unnecessary.

    9. Who will perform and support the work?

    Identify the contracting company, installer, any subcontractors, and service contact. The CPUC’s consumer guide recommends comparing bids from at least three qualified providers and checking contractor credentials. Ask for the relevant license information and verify it independently.

    10. What do the warranties actually cover?

    Separate equipment, workmanship, roof-penetration coverage, and any production commitment. Ask who pays labor, diagnostic visits, shipping, and removal or reinstallation when applicable. Obtain the actual warranty documents. A long headline term is less informative than the coverage and claim process.

    11. What happens if I sell or need roof work?

    Have the provider point to the relevant transfer, removal, and reinstallation terms. Request a written explanation of any fees or approvals. Do not assume that an advertised transferable agreement has no conditions.

    12. Which forecast assumptions drive the savings?

    Ask to see the utility escalation, system degradation, storage assumptions, and excluded expenses. Request an alternative scenario with less favorable assumptions. The FTC’s solar guidance encourages detailed bid and contract comparisons and cautions that future electricity rates are difficult to predict.

    Frequently asked questions

    Is the cheapest solar quote always best?

    No single price determines fit. Compare the complete scope, design quality, responsibilities, and contract terms before deciding.

    What should I bring to a quote review?

    Bring all proposal pages, 12 months of electricity use, the utility rate name, and a list of your backup or future-use goals. Include financing and warranty documents.

    Our assessment can help organize questions about an Axia by Qcells proposal. It is a sales consultation, not an independent ranking of every installer.

    Want to understand the options for your property? Request a free solar assessment. Los Angeles Solar Advisory helps homeowners in Los Angeles, Riverside, and Ventura counties explore solar options through consultations representing Axia by Qcells. Your proposal should reflect your home, utility, and contract terms.

  • How Much Do People Save With Solar in 2026?

    How Much Do People Save With Solar in 2026?

    Going solar in 2026 looks different than it did just a few years ago. With shifting incentives, evolving net metering rules, and electricity rates that keep climbing, the question of how much do people save with solar deserves a fresh, numbers-driven answer. This guide breaks down the real costs, real savings, and real payback timelines homeowners face right now.

    Key Takeaways

    Most homeowners in the U.S. who buy a solar panel system in 2026 save between $25,000 and $70,000 on electricity bills over 25–30 years, depending on state and system size. Lifetime savings for solar panel installations typically range from $41,000 to over $155,000 when factoring in location and electricity rates.

    Here’s a concrete example: a typical 7 kW solar system installed in 2026 at about $2.75 per watt (around $19,250 before incentives) can cost roughly $13,475 after the 30% federal tax credit and save about $1,400–$1,900 per year on electric bills at $0.16–$0.22 per kWh.

    • Savings are largest in high-cost electricity states like California, New York, and Massachusetts, especially where net metering or strong export credits exist.
    • Your actual savings depend on your solar panel system size, roof orientation, local rates, local incentives, and whether you buy, finance, or lease the system.
    • Homeowners save over $60,000 on average with solar over 25 years, with average monthly savings that can reach $600+ in Southern California.
    • Solar panels typically last 25 to 30 years, making them a long term asset that continues to produce value well beyond the payback window.
    The image shows residential solar panels installed on the roof of a sunny suburban house, set against a clear blue sky. This solar panel system harnesses sunlight to produce energy, potentially helping homeowners save money on their electricity bills and reduce the impact of higher electricity costs over time.

    How Much Can You Save on Electricity Bills With Solar Panels?

    Most homeowners who install solar panels in 2026 save roughly $60,000 over 25 years nationwide. Individuals can save significantly on electricity bills by switching to solar energy, and average annual savings for U.S. homeowners after switching to solar range from $1,000 to $2,500 depending on location and system size.

    Consider a household using 2000 kWh per month with a $0.35/kWh electric rate. That household pays about $700 per month, or $8400 per year. A properly sized solar system could cut this to roughly $350–$500 per month in fixed connection charges, saving $2,000–$2,800 per year. Solar systems can eliminate monthly electricity bills in many cases, leaving only the small grid-access fee.

    A 6–10 kW solar system typically covers 80–100% of annual electricity use for a detached single-family home. Rising utility rates historically outpace inflation-most models assume 2–4% annual increases-so lifetime solar savings often exceed initial projections. Some homeowners with excellent sun exposure and strong net metering policies regularly see near-zero electric bills for the entire year.

    Explore an illustrative solar payment comparison

    Calculator preview is available in the authorized draft preview only.

    Example defaults are assumptions, not California averages or offered contract terms. This models recurring payments only—not a cash purchase or a complete financial analysis. It excludes upfront costs, fees, incentives, maintenance, equipment replacement, and changes in usage or system performance. Actual solar payments, utility charges, and savings vary.

    Average Solar System Costs in 2026 (Before and After Tax Credits)

    As of 2026, installing a solar system costs between $15,000 and $30,000 before incentives for a typical residential setup of 6 to 10 kW. A solar system size of 6 to 10 kW is typical for most homes, and the average solar system costs about $2.50 to $3.00 per watt. This represents a significant investment, but equipment prices have dropped substantially compared to where they were years ago.

    State-level pricing varies: Arizona installers often come in around $2.10 per watt, California averages closer to $2.80/W, and Massachusetts can reach $3.40/W.

    The 30% federal Investment Tax Credit (ITC) through 2032 dramatically changes the math. Federal tax credits can reduce solar installation costs by 30%. On a $21,000 system, that’s a $6,300 tax credit, bringing the net price to $14,700. Additional state and local rebates in places like New York, New Jersey, and Illinois can further drop net cost by $1,000–$5,000. Higher-efficiency solar panels and premium inverters cost more upfront but can increase long term savings, especially on smaller roofs where every square foot matters.

    How Solar Savings Work: From Electric Bill to Solar Power

    A grid-tied solar panel system lowers electricity bills through a straightforward process: your panels produce kilowatt-hours during the day, which offset the kWh you would otherwise buy from the utility. Energy charges shrink or disappear, fixed connection fees remain, and in some states solar system owners receive credits via net metering for excess power sent to the grid.

    Here’s how a monthly bill typically changes:

    Pre-Solar

    Post-Solar

    Energy charges

    ~$150

    $0–$15

    Fixed fees

    ~$25

    ~$25

    Total

    ~$175

    $25–$40

    Solar power savings show up both immediately through lower monthly charges and long term through protection from future rate hikes. This creates the core return on investment for most people. Solar production is seasonal-higher summer credits often offset lower winter production in regions with full or near-full net metering.

    A close-up view shows a solar installer carefully placing solar panels on a residential roof under bright daylight, highlighting the importance of solar power as a significant investment for homeowners looking to save money on electricity bills and reduce higher electricity costs over time.

    Key Factors That Affect How Much You Save With a Solar Panel System

    Several variables change your total savings. Here are the most important ones to focus on:

    • Electricity rates: Higher local utility rates enhance savings from solar panel installations. In parts of California ($0.33/kWh), Hawaii ($0.45+), and New England ($0.30+), each kilowatt-hour of solar power is worth significantly more, often doubling lifetime dollar savings compared with low-cost states.
    • System size: A correctly sized solar system matched to your 12-month usage history tends to maximize savings. Oversizing may lead to low-value exports, while undersizing leaves you paying more on your electric bill.
    • Roof orientation and shading: South-facing, unshaded roofs in the U.S. generally deliver the strongest output. Heavy shading or complex rooflines may significantly reduce production by 10–30%.
    • Rate plan and batteries: Your chosen rate plan (flat rate vs. time-of-use) and whether you add battery storage can change when and how your solar energy offsets grid power costs.
    • Sunlight and location: Homes in sunnier states generate more electricity, making location one of the biggest determinants of savings.

    System Size, Panel Efficiency, and How They Translate Into Savings

    The size of your solar power system in kW and the efficiency of the solar panels largely determine how many kWh you produce and how much money you save. System size impacts electricity production and savings directly.

    A simple formula: expected annual output ≈ system size (kW) × annual production factor (1,200–1,600 kWh per kW in most U.S. locations). A 7 kW system in a state averaging 1,400 kWh/kW produces about 9,800 kWh in year one.

    Modern monocrystalline solar panels in 2026 often reach 20–22% efficiency, allowing more power from limited roof area. REC offers some of the best solar panels according to EnergySage, and Hyundai NF(BK) panels have reached 22.5% efficiency with a 30-year warranty, showing how manufacturer competition benefits customers.

    Here’s a quick compare between two system sizes on the same average home:

    5 kW System

    10 kW System

    Annual output

    ~7,000 kWh

    ~14,000 kWh

    Annual savings (at $0.18/kWh)

    ~$1,260

    ~$2,520

    Best for

    Smaller households

    High-usage homes

    The best financial outcome is often reached when the solar panel system is sized to cover 90–110% of historic annual usage.

    Location, Net Metering, and Local Policies: Why Where You Live Matters

    The same solar system can save very different amounts in different states due to sun levels, electricity prices, and policy frameworks. States with favorable net metering policies allow for significant savings by sending excess power back to the grid.

    Net metering works like this: when your solar system sends excess electricity to the grid, you receive credits that offset electricity you pull from the grid at other times, often at or near the retail rate. Net metering policies can enhance savings by selling excess electricity back to the utility. Utility buyback policies affect the savings generated from excess electricity sent back to the grid.

    Specific examples:

    • California, New York, New Jersey: Favorable or partial net metering with higher electricity costs, often yielding payback in 7–10 years.
    • Texas, parts of the Southeast: Lower electricity prices and weaker export credits, stretching payback to 15–20 years.

    Some utilities have shifted to “net billing” or export rates below the retail rate, which lengthens payback periods but still usually yields strong long term savings. For renters or shaded-home owners, community solar or shared solar options can still reduce electricity bills using solar power even without installing panels on their own roof.

    An aerial view of a residential neighborhood showcases multiple houses equipped with solar panels on their rooftops, highlighting the growing trend of homeowners investing in solar power systems to significantly reduce their electricity bills and benefit from local incentives. The image emphasizes the long-term financial benefits and efficiency of solar energy in combating higher electricity costs.

    Government Incentives, Tax Credits, and How They Boost Solar Savings

    Incentives don’t just lower upfront costs-they shorten the time it takes solar panels to pay for themselves, boosting overall return on investment.

    The federal 30% ITC works in practical terms: homeowners who owe federal income tax can subtract 30% of the total cost of a solar project-including equipment, labor, electrical upgrades, and battery if installed-from their tax bill for the year of installation. Rollovers are allowed while current rules remain.

    Several states provide additional rebates or performance payments:

    • New York: NY-Sun incentives
    • Massachusetts: SMART program
    • Illinois: Illinois Shines

    Some utilities offer one-time rebates or ongoing bill credits for solar power. Combining these with the federal tax credit dramatically improves effective solar savings.

    Example: A $25,000 solar + battery project with the 30% federal credit ($7,500) plus a $3,000 state rebate brings the net total cost down to roughly $14,500-a price point where the financial benefits become hard to ignore.

    Solar Payback Periods: When Do Solar Panels Pay for Themselves?

    The solar payback period is the number of years it takes for electric bill savings to equal the net cost of the solar panel system after incentives. Payback periods for solar systems typically range from 6 to 12 years. Most homeowners break even on solar investments in about 10 years.

    Simple calculation: net system cost ÷ annual savings = payback in years. For example, $16,000 ÷ $1,800/year ≈ 8.9 years. In 2026, most homeowners see payback periods between 6 and 12 years, with the fastest paybacks in high-rate, pro-solar states and the slowest in low-rate regions with weak net metering.

    Once the system has paid for itself, the remaining 15–20+ years of panel life are essentially years of free or deeply discounted solar power, minus any maintenance costs. Adding a battery can lengthen the payback somewhat but may still make financial sense in areas with time-of-use rates or frequent outages.

    Ownership vs. Solar Leasing and PPAs: Which Saves More?

    Three models exist for going solar: buying your solar system (cash or loan), leasing solar panels, and power purchase agreements (PPAs). Buying a solar system can save more money long term. Financing methods significantly impact overall savings potential for solar panel systems.

    When you buy the system, you receive federal tax credits and most incentives, and your savings accumulate as the system continues to offset your electric bill beyond the loan payoff period. This is how most people maximize their return.

    Leasing involves paying for energy generated, not a fixed fee in many cases, while PPAs lock in a per-kWh rate typically set below the local utility’s price but with escalators in many contracts. Leasing may be more accessible after tax credit changes, especially for homeowners who can’t use the credit directly. Federal tax credits still exist for solar leases and PPAs because the third-party owner claims them.

    Solar leasing or PPAs may still lower monthly electric bills, but they typically yield smaller total savings than owning the system outright. Carefully review contract terms, escalator clauses, buyout options, and what happens if you sell the home-these details crucially impact long term savings and your overall decision making process.

    How to Estimate Your Own Solar Savings

    Start with your past 12 months of electricity bills. This is the foundation of any customized solar savings estimate and the best research you can do before contacting an installer.

    Basic steps:

    1. Add up your total annual kWh usage from your bills.
    2. Find your effective electricity rate (total energy charges ÷ total kWh).
    3. Estimate a solar system size that covers 90–100% of that usage (divide annual kWh by your location’s production factor of ~1,300–1,500 kWh/kW).

    Use reputable online solar calculators or satellite-based estimators to refine assumptions about sunlight exposure and production on your specific roof. Getting multiple quotes from experienced local solar installers who understand your utility’s rate structures and interconnection rules is essential.

    When you compare proposals, look at cost per watt, estimated annual production, assumed rate escalation, and projected 20–25 year savings-not just the advertised “zero-down” payment. That’s where the real sign of a quality solar installer shows up.

    A person is sitting at a desk, closely reviewing their energy bills while sunlight streams through a nearby window, highlighting the potential financial benefits of solar power and the savings it can offer against higher electricity costs. The scene suggests a moment of decision-making about investing in a solar panel system to reduce future energy expenses.

    Frequently Asked Questions About Solar Savings

    Can solar panels completely eliminate my electric bill?

    In many states, a well-sized solar panel system can reduce the variable portion of the electric bill to near zero for much of the year, but most utilities still charge a small fixed monthly connection fee. Total bill elimination is unlikely unless you go fully off-grid with significant battery capacity, which is rare and more expensive. In regions with reduced net metering or export caps, you may always pay for some grid-supplied electricity, especially at night or during winter months.

    Do solar panels still save money if I work from home and use more electricity during the day?

    Heavier daytime usage often increases solar savings because more of your solar power is used in real time rather than exported at potentially lower rates. Someone running a home office with computers and HVAC during peak sun hours can offset a larger share of their high-cost kWh with their own solar power. Pairing solar with efficient equipment and smart thermostats can compound savings for work-from-home households.

    What happens to my solar savings if utility rates go down?

    While short-term rate dips are possible, long term historical trends show electricity prices generally rising over decades. Solar savings projections typically assume modest annual rate increases of 2–4% per year, so if rates stay flat, total savings may be somewhat lower than expected but still substantial. Even in a flat-rate scenario, once the solar system is paid off, you still benefit from low ongoing energy costs.

    Do I still save money with solar if my roof is partly shaded?

    Partial shading does reduce solar system output and savings, but modern panel-level electronics like microinverters or DC optimizers can limit the negative impact. A good solar installer will model shading during the installation process and may recommend trimming trees, changing panel layout, or using higher-efficiency solar panels to maintain strong savings. If shading is severe for most of the day, options like community solar or a ground-mount system might be better. Note that when trying to watch educational solar videos online, if playback doesn’t begin shortly after you sign in to YouTube on your computer, check your watch history and influence settings-sometimes an error occurred while retrieving content, or the video may have been added to the tv’s queue if you subscribe subscribed to history and influence tv channels along using the transcript feature. This happened more frequently 3y ago on older YouTube on your computer setups.

    How long do solar panels keep saving money after installation?

    Most modern solar panels come with 25-year performance warranties, and many continue producing meaningful electricity for 30 years or more. Solar panels typically last 25 to 30 years, and even at 80–85% of original output after 25 years, they can still offset a significant portion of a home’s electric bill. Inverters may need replacement around years 10–15 for maintenance, and common lithium-ion batteries have a similar life span, which should be factored into long term savings estimates.